
11 Most Important DS Plots
...summarized visually.

🔥 Generate LLM-ready text files from website URL

FireCrawl has released the /llms.txt endpoint that lets you convert any website into a single file standard for AI.
Just add llmstxt.new in front of any URL, and you're done! For instance, “domain.com” will become “llmstxt.new/domain.com.”
Thanks to Firecrawl for partnering today!
11 Most Important DS Plots
This visual depicts the 11 most important and must-know plots in DS:
Today, let’s understand them briefly and how they are used.
1) KS Plot:

It is used to assess the distributional differences.
The idea is to measure the maximum distance between the cumulative distribution functions (CDF) of two distributions.
The lower the maximum distance, the more likely they belong to the same distribution.
2) SHAP Plot:
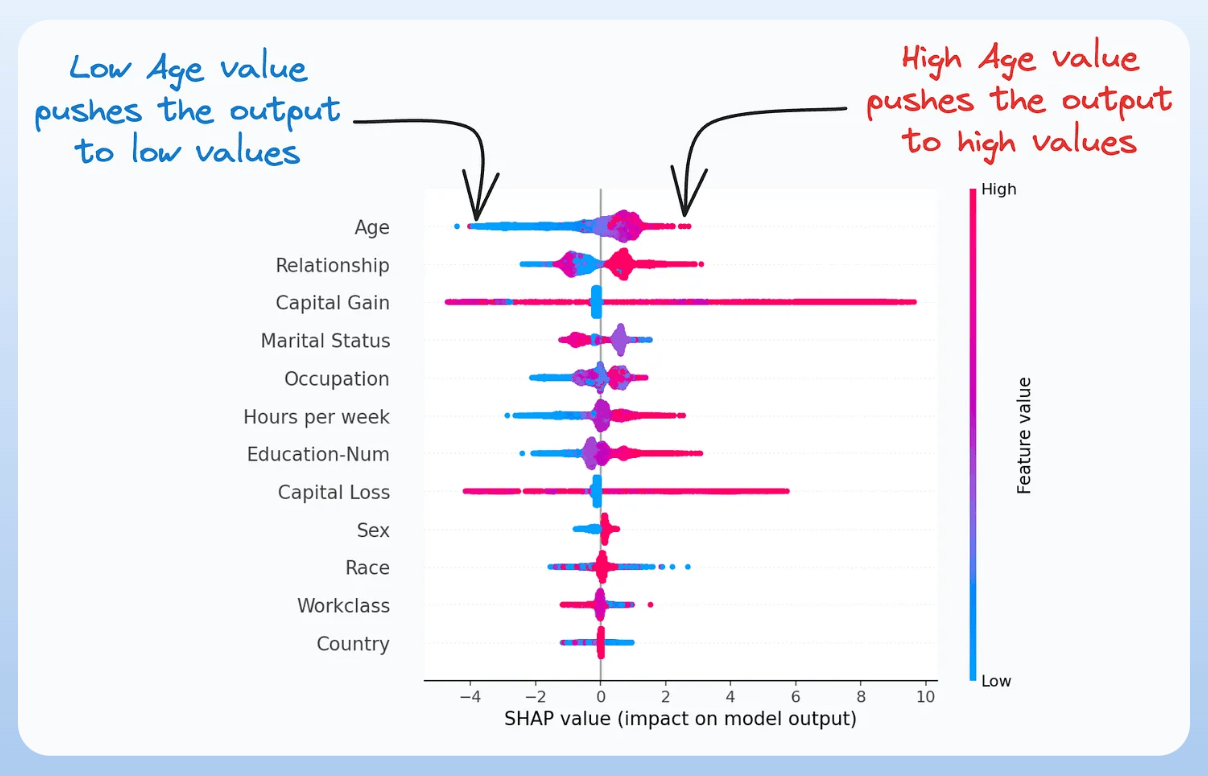
It summarizes feature importance to a model’s predictions by considering interactions/dependencies between them.
It is useful in determining how different values (low or high) of a feature affect the overall output.
We covered model interpretability extensively in our 3-part crash course. Start here: A Crash Course on Model Interpretability →
3) ROC Curve:

It depicts the tradeoff between the true positive rate (good performance) and the false positive rate (bad performance) across different classification thresholds.
The idea is to balance TPR (good performance) vs. FPR (bad performance).
4) Precision-Recall Curve:
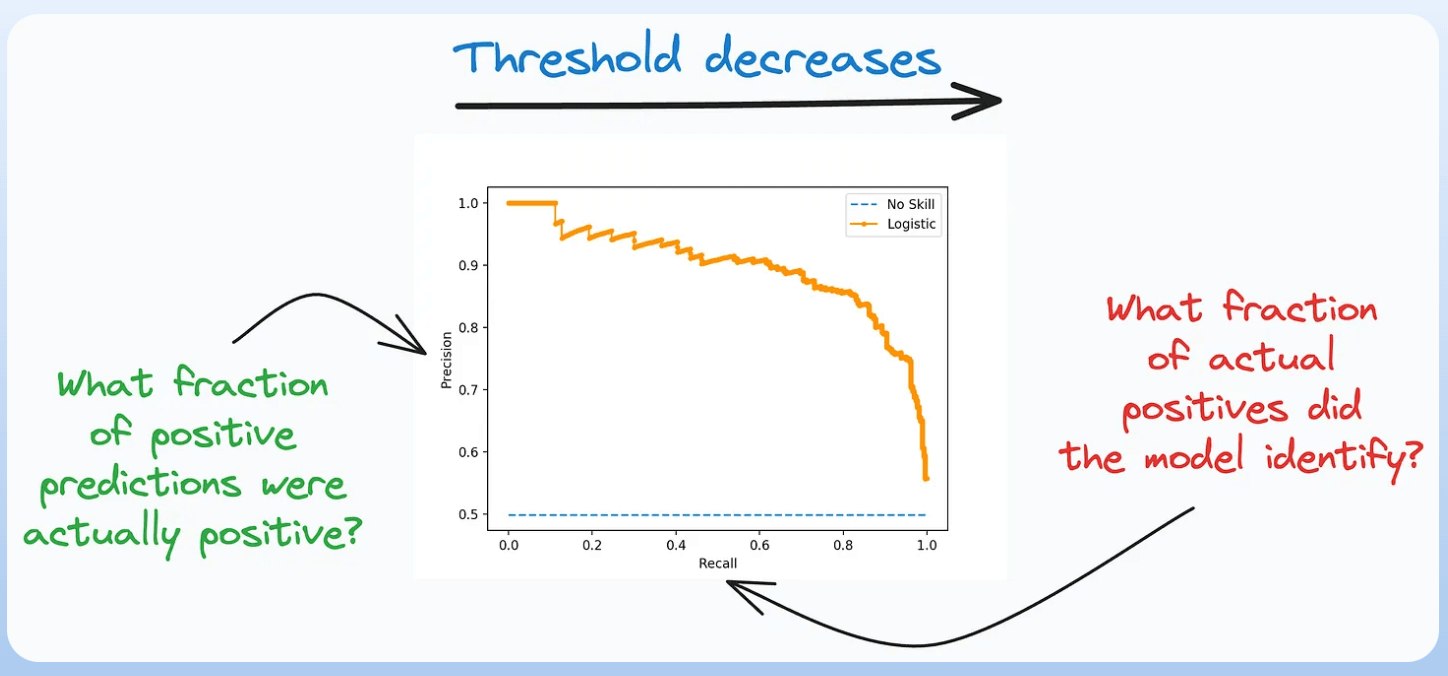
It depicts the tradeoff between Precision and Recall across different classification thresholds.
5) QQ Plot:
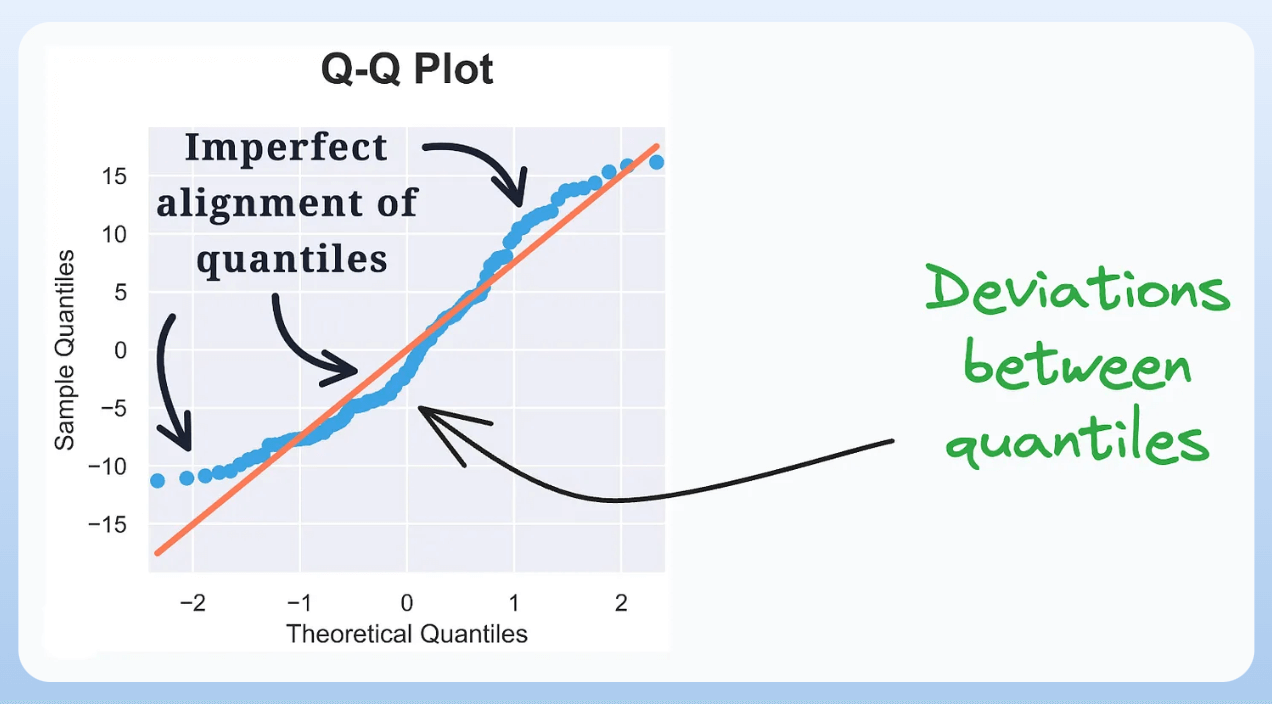
It assesses the distributional similarity between observed data and theoretical distribution.
It plots the quantiles of the two distributions against each other.
Deviations from the straight line indicate a departure from the assumed distribution.
6) Cumulative Explained Variance Plot:
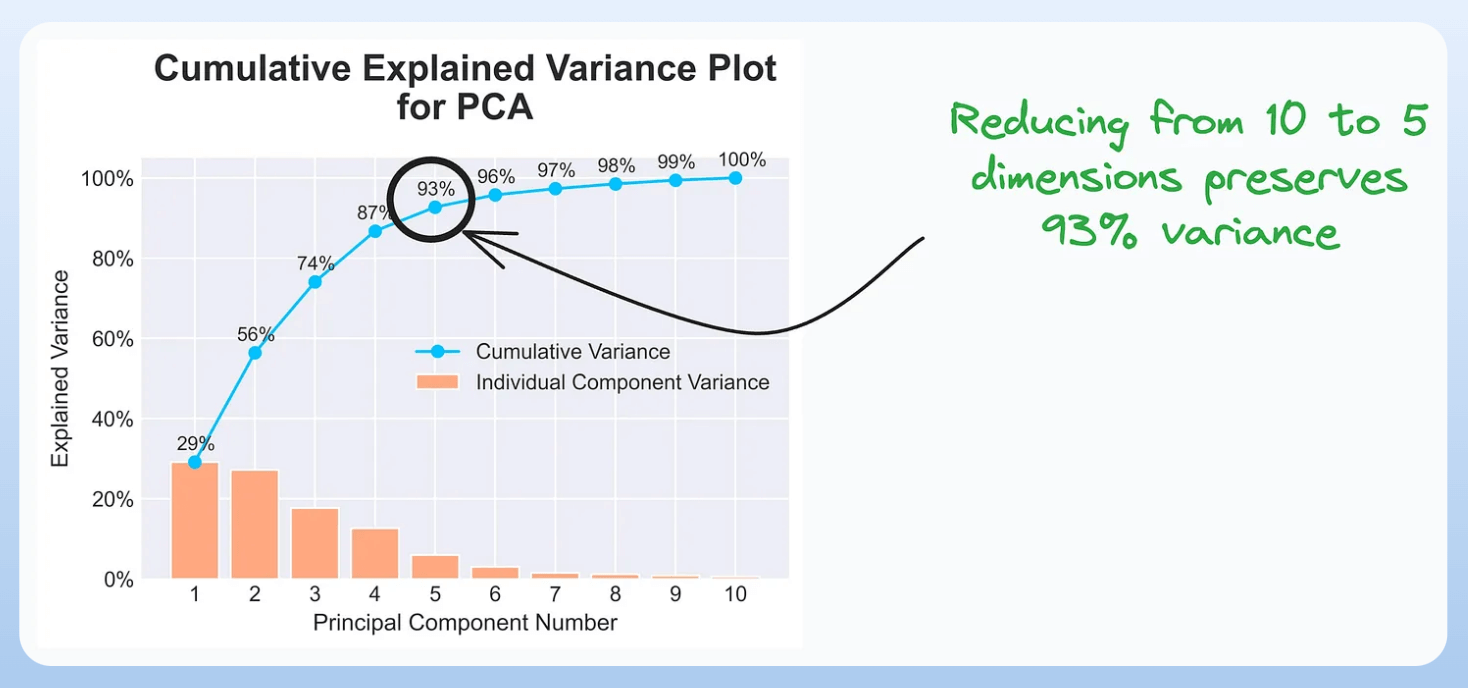
It is useful in determining the number of dimensions we can reduce our data to while preserving max variance during PCA.
Read the full article on PCA here for more clarity: Formulating the Principal Component Analysis (PCA) Algorithm From Scratch.
7) Elbow Curve:

The plot helps identify the optimal number of clusters for the k-means algorithm.
The point of the elbow depicts the ideal number of clusters.
8) Silhouette Curve:

The Elbow curve is often ineffective when you have plenty of clusters.
Silhouette Curve is a better alternative, as depicted above.
9) Gini-Impurity and Entropy:

They are used to measure the impurity or disorder of a node or split in a decision tree.
The plot compares Gini impurity and Entropy across different splits.
This provides insights into the tradeoff between these measures.
10) Bias-Variance Tradeoff:

It’s probably the most popular plot on this list.
It is used to find the right balance between the bias and the variance of a model against complexity.
11) Partial Dependency Plots:

Depicts the dependence between target and features.
A plot between the target and one feature forms → 1-way PDP.
A plot between the target and two feature forms → 2-way PDP.
In the leftmost plot, an increase in temperature generally results in a higher target value.
We covered model interpretability extensively in our 3-part crash course. Start here: A Crash Course on Model Interpretability →
👉 Over to you: Which important plots have I missed here?
Thanks for reading!
P.S. For those wanting to develop “Industry ML” expertise:

At the end of the day, all businesses care about impact. That’s it!
Can you reduce costs?
Drive revenue?
Can you scale ML models?
Predict trends before they happen?
We have discussed several other topics (with implementations) that align with such topics.
Here are some of them:
Learn how to build Agentic systems in an ongoing crash course with 6 parts.
Learn how to build real-world RAG apps and evaluate and scale them in this crash course.

Learn sophisticated graph architectures and how to train them on graph data in this crash course.
So many real-world NLP systems rely on pairwise context scoring. Learn scalable approaches here.
Learn how to run large models on small devices using Quantization techniques.
Learn how to generate prediction intervals or sets with strong statistical guarantees for increasing trust using Conformal Predictions.
Learn how to identify causal relationships and answer business questions using causal inference in this crash course.
Learn how to scale and implement ML model training in this practical guide.
Learn techniques to reliably test new models in production.
Learn how to build privacy-first ML systems using Federated Learning.
Learn 6 techniques with implementation to compress ML models.
All these resources will help you cultivate key skills that businesses and companies care about the most.