11 Types of Variables in a Dataset
Beyond features, targets, etc.
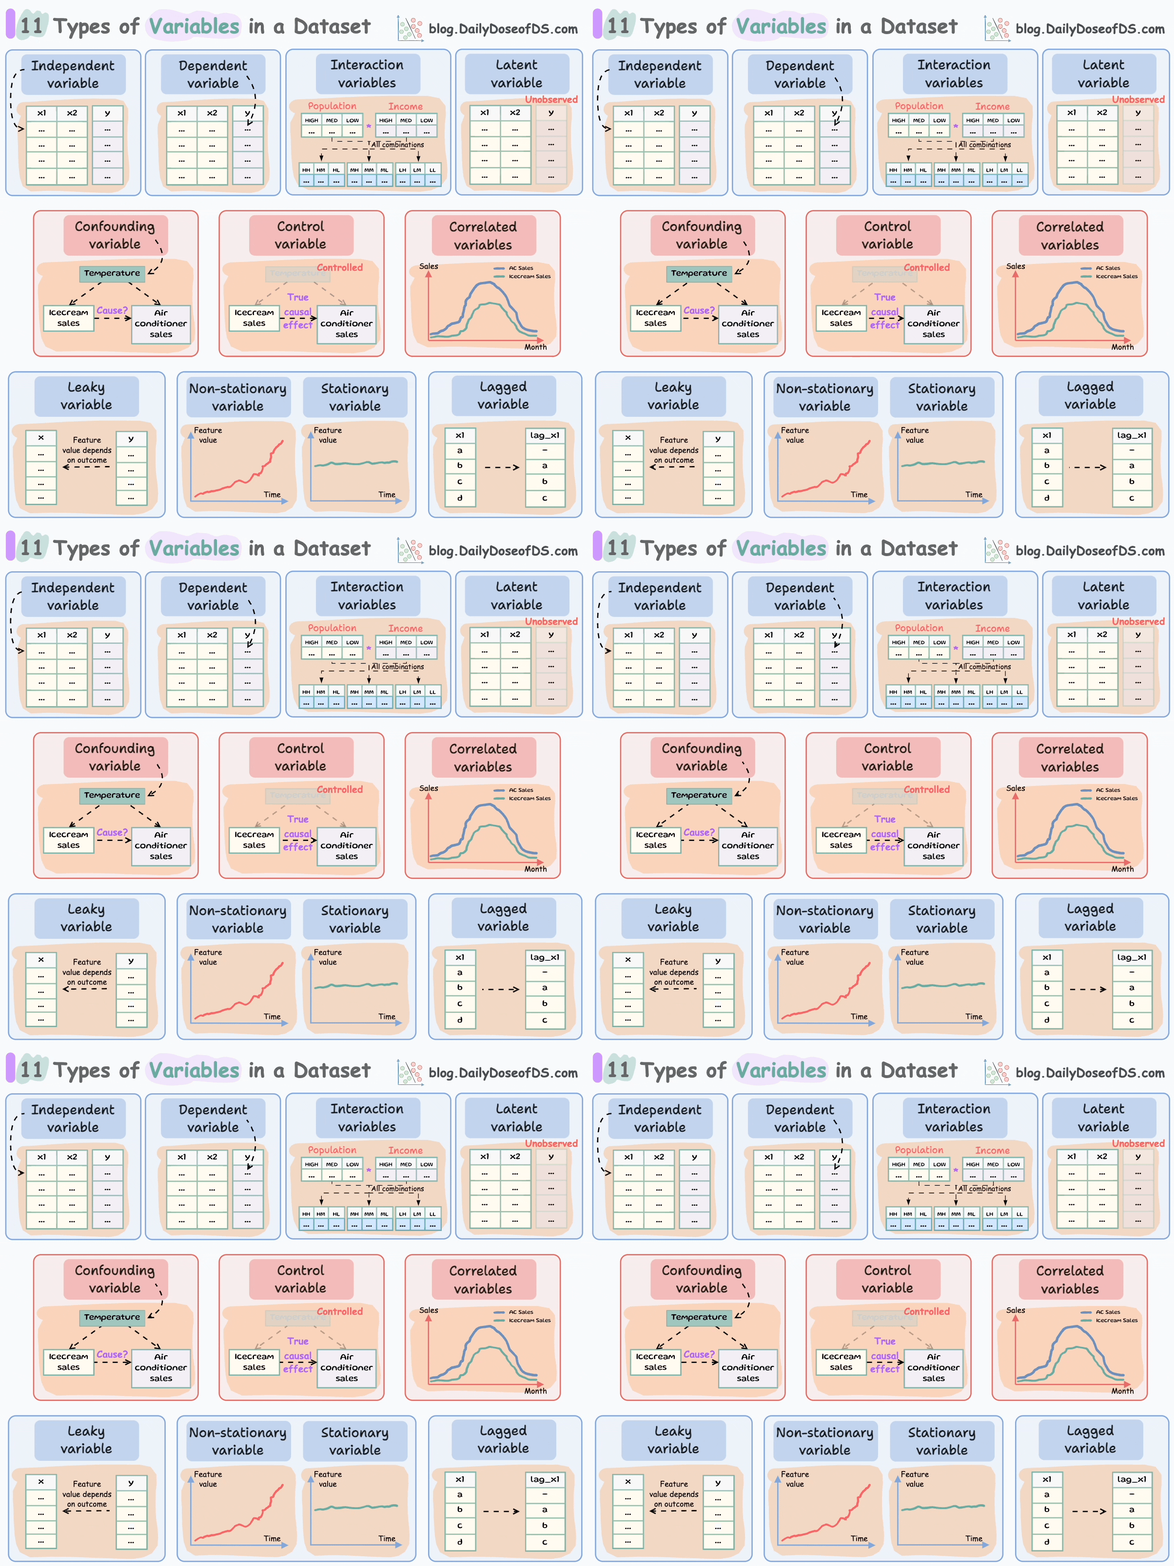
In any tabular dataset, we typically categorize the columns as either a feature or a target.
However, there are so many variables that one may find/define in their dataset, which I want to discuss today.
These are depicted in the animation below:
Let’s begin!
#1-2) Independent and dependent variables
These are the most common and fundamental to ML.
Independent variables are the features that are used as input to predict the outcome. They are also referred to as predictors/features/explanatory variables.
The dependent variable is the outcome that is being predicted. It is also called the target, response, or output variable.
#3-4) Confounding and correlated variables
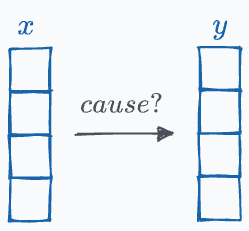
Confounding variables are typically found in a cause-and-effect study (causal inference).
These variables are not of primary interest in the cause-and-effect equation but can potentially lead to spurious associations.
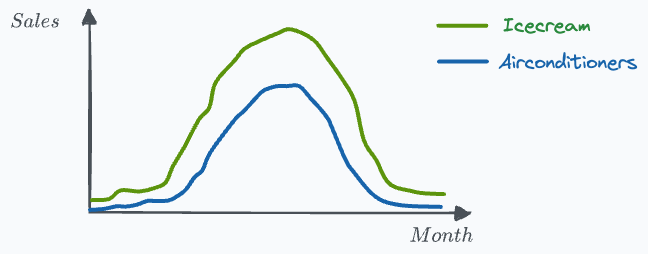
To exemplify, say we want to measure the effect of ice cream sales on the sales of air conditioners.
As you may have guessed, these two measurements are highly correlated.
However, there’s a confounding variable — temperature, which influences both ice cream sales and the sales of air conditioners.
To study the true casual impact, it is essential to consider the confounder (temperature). Otherwise, the study will produce misleading results.
In fact, it is due to the confounding variables that we hear the statement: “Correlation does not imply causation.”
In the above example:
There is a high correlation between ice cream sales and sales of air conditioners.
But the sales of air conditioners (effect) are NOT caused by ice cream sales.
Also, in this case, the air conditioner and ice cream sales are correlated variables.
More formally, a change in one variable is associated with a change in another.
#5) Control variables
In the above example, to measure the true effect of ice cream sales on air conditioner sales, we must ensure that the temperature remains unchanged throughout the study.
Once controlled, temperature becomes a control variable.
More formally, these are variables that are not the primary focus of the study but are crucial to account for to ensure that the effect we intend to measure is not biased or confounded by other factors.
#6) Latent variables
A variable that is not directly observed but is inferred from other observed variables.
For instance, we use clustering algorithms because the true labels do not exist, and we want to infer them somehow.
The true label is a latent variable in this case.
Another common example of a latent variable is “intelligence.”
Intelligence itself cannot be directly measured; it is a latent variable.
However, we can infer intelligence through various observable indicators such as test scores, problem-solving abilities, and memory retention.
We also learned about Latent variables when we studied Gaussian mixture models if you remember.
#7) Interaction variables
As the name suggests, these variables represent the interaction effect between two or more variables, and are often used in regression analysis.
Here’s an instance I remember using them in.
In a project, I studied the impact of population density and income levels on spending behavior.
I created three groups for population density — HIGH, MEDIUM, and LOW (one-hot encoded).
Likewise, I created three groups for income levels — HIGH, MEDIUM, and LOW (one-hot encoded).
To do regression analysis, I created interaction variables by cross-multiplying both one-hot columns.
This produced 9 interaction variables:
Population-High and Income-High
Population-High and Income-Med
Population-High and Income-Low
Population-Med and Income-High
and so on…
Conducting the regression analysis on interaction variables revealed more useful insights than what I observed without them.
To summarize, the core idea is to study two or more variables together rather than independently.
#8-9) Stationary and Non-Stationary variables:
The concept of stationarity often appears in time-series analysis.
Stationary variables are those whose statistical properties (mean, variance) DO NOT change over time.
On the flip side, if a variable’s statistical properties change over time, they are called non-stationary variables.
Preserving stationarity in statistical learning is critical because these models are fundamentally reliant on the assumption that samples are identically distributed.
But if the probability distribution of variables is evolving over time, (non-stationary), the above assumption gets violated.
That is why, typically, using direct values of the non-stationary feature (like the absolute value of the stock price) is not recommended.
Instead, I have always found it better to define features in terms of relative changes:
#10) Lagged variables
Talking of time series, lagged variables are pretty commonly used in feature engineering and data analytics.
As the name suggests, a lagged variable represents previous time points’ values of a given variable, essentially shifting the data series by a specified number of periods/rows.
For instance, when predicting next month’s sales figures, we might include the sales figures from the previous month as a lagged variable.
Lagged features may include:
7-day lag on website traffic to predict current website traffic.
30-day lag on stock prices to predict the next month’s closing prices.
And so on…
#11) Leaky variables
Yet again, as the name suggests, these variables (unintentionally) provide information about the target variable that would not be available at the time of prediction.
This leads to overly optimistic model performance during training but fails to generalize to new data.
I recently talked about leaky variable(s) in this newsletter through random splitting.
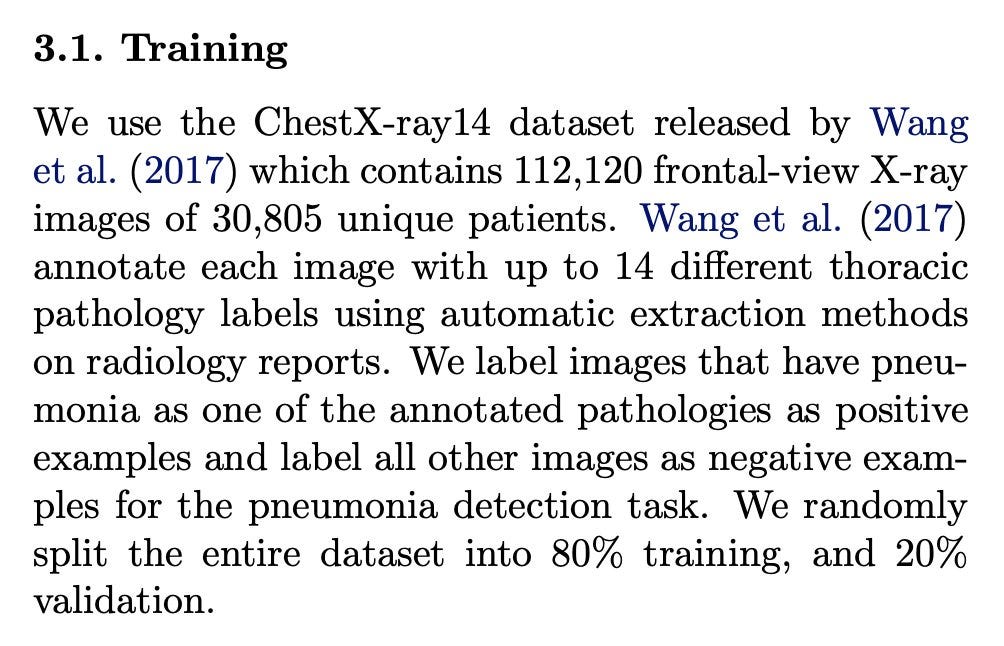
To reiterate, consider a dataset containing medical imaging data.
Each sample consists of multiple images (e.g., different views of the same patient’s body part), and the model is intended to detect the severity of a disease.
In this case, randomly splitting the images into train and test sets will result in data leakage.
This is because images of the same patient will end up in both the training and test sets, allowing the model to “see” information from the same patient during training and testing.
Here’s a paper which committed this mistake (and later corrected it):
To avoid this, a patient must only belong to the test or train/val set, not both.
This is called group splitting:
Creating forward-lag features is another way leaky variables get created unintentionally at times:
That’s it.
From the above discussion, it is pretty clear that there is a whole world of variables beyond features, targets, categorical and numerical variables, etc.
Of course, there are a few more types of variables that I haven’t covered here, as I intend to cover them in another issue.
But till then, can you tell me which ones I have missed?
Thanks for reading!
Extended piece #1
There are many issues with Grid search and random search.
They are computationally expensive due to exhaustive search.
The search is restricted to the specified hyperparameter range. But what if the ideal hyperparameter exists outside that range?
They can ONLY perform discrete searches, even if the hyperparameter is continuous.
Bayesian optimization solves this.
It’s fast, informed, and performant, as depicted below:
Learning about optimized hyperparameter tuning and utilizing it will be extremely helpful to you if you wish to build large ML models quickly.
👉 Read it here: Bayesian Optimization for Hyperparameter Tuning.
Extended piece #2
Linear regression is powerful, but it makes some strict assumptions about the type of data it can model, as depicted below.
Can you be sure that these assumptions will never break?
Nothing stops real-world datasets from violating these assumptions.
That is why being aware of linear regression’s extensions is immensely important.
Generalized linear models (GLMs) precisely do that.
They relax the assumptions of linear regression to make linear models more adaptable to real-world datasets.
👉 Read it here: Generalized linear models (GLMs).
Are you preparing for ML/DS interviews or want to upskill at your current job?
Every week, I publish in-depth ML dives. The topics align with the practical skills that typical ML/DS roles demand.
Join below to unlock all full articles:
👉 If you love reading this newsletter, share it with friends!
👉 Tell the world what makes this newsletter special for you by leaving a review here :)


Did you label independent and dependent correctly in the first chart?
Very clear and informative. Yet again.