9 Must-Know Methods To Test Data Normality
A guide to plotting and statistical methods.
The normal distribution is the most popular distribution in data science.
Many ML models assume (or work better) under the presence of normal distribution.
For instance:
linear regression assumes residuals are normally distributed
at times, transforming the data to normal distribution can be beneficial (Read one of my previous posts on this here)
linear discriminant analysis (LDA) is derived under the assumption of normal distribution
and many more.
Thus, being aware of the ways to test normality is extremely crucial for data scientists.
The visual above depicts the 9 most common methods to test normality.
#1) Plotting methods:
Histogram
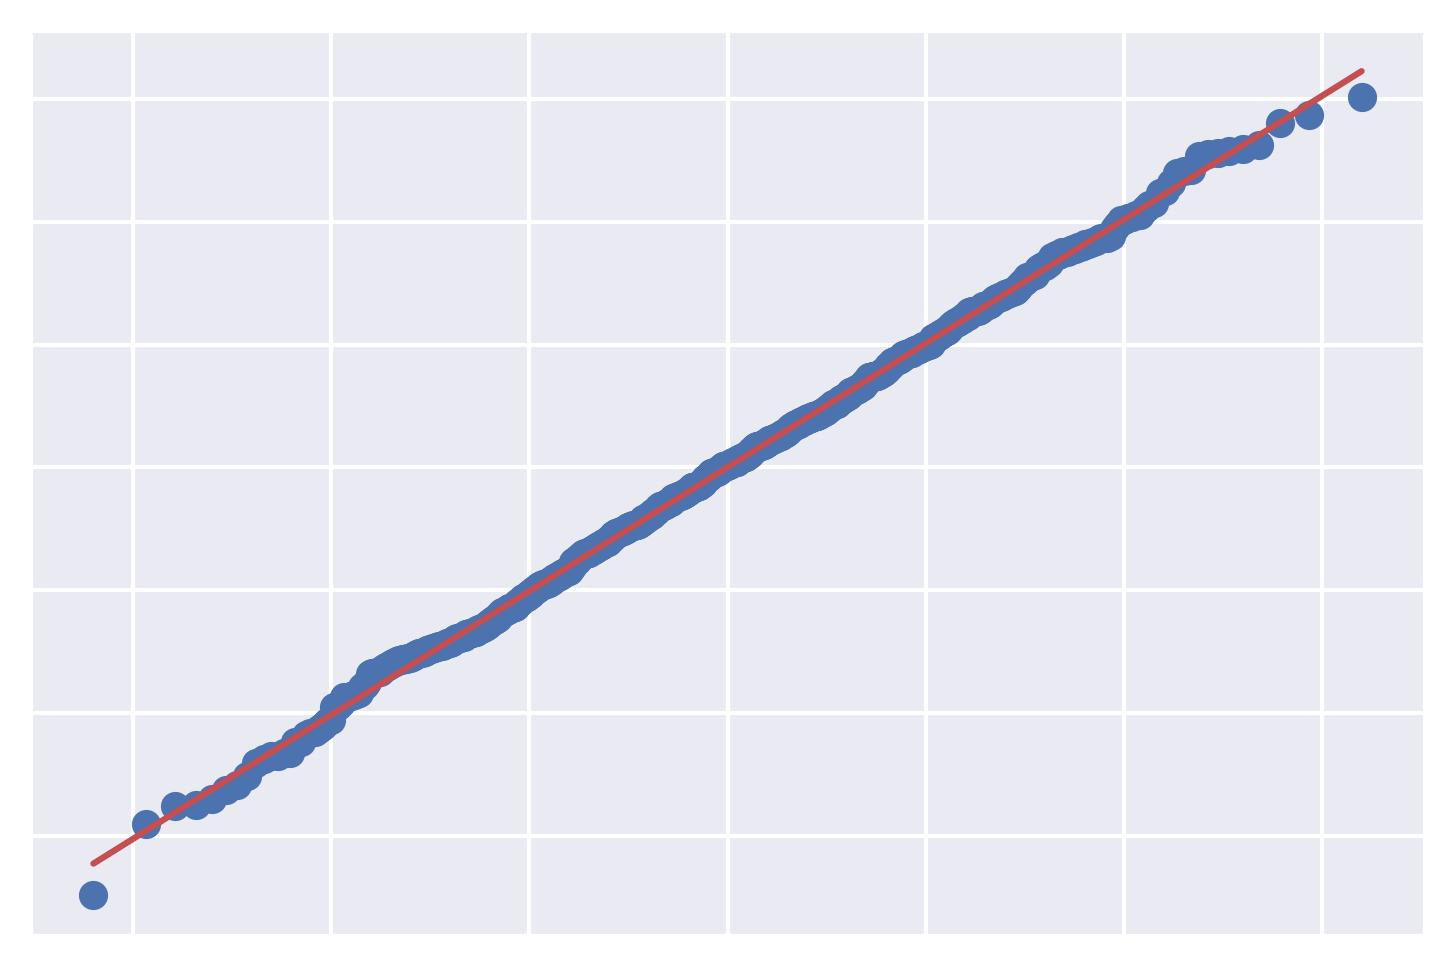
QQ Plot:
It depicts the quantiles of the observed distribution (the given data in this case) against the quantiles of a reference distribution (the normal distribution in this case).
A good QQ plot will show minimal deviations from the reference line, indicating that the data is approximately normally distributed.
A bad QQ plot will exhibit significant deviations, indicating a departure from normality.
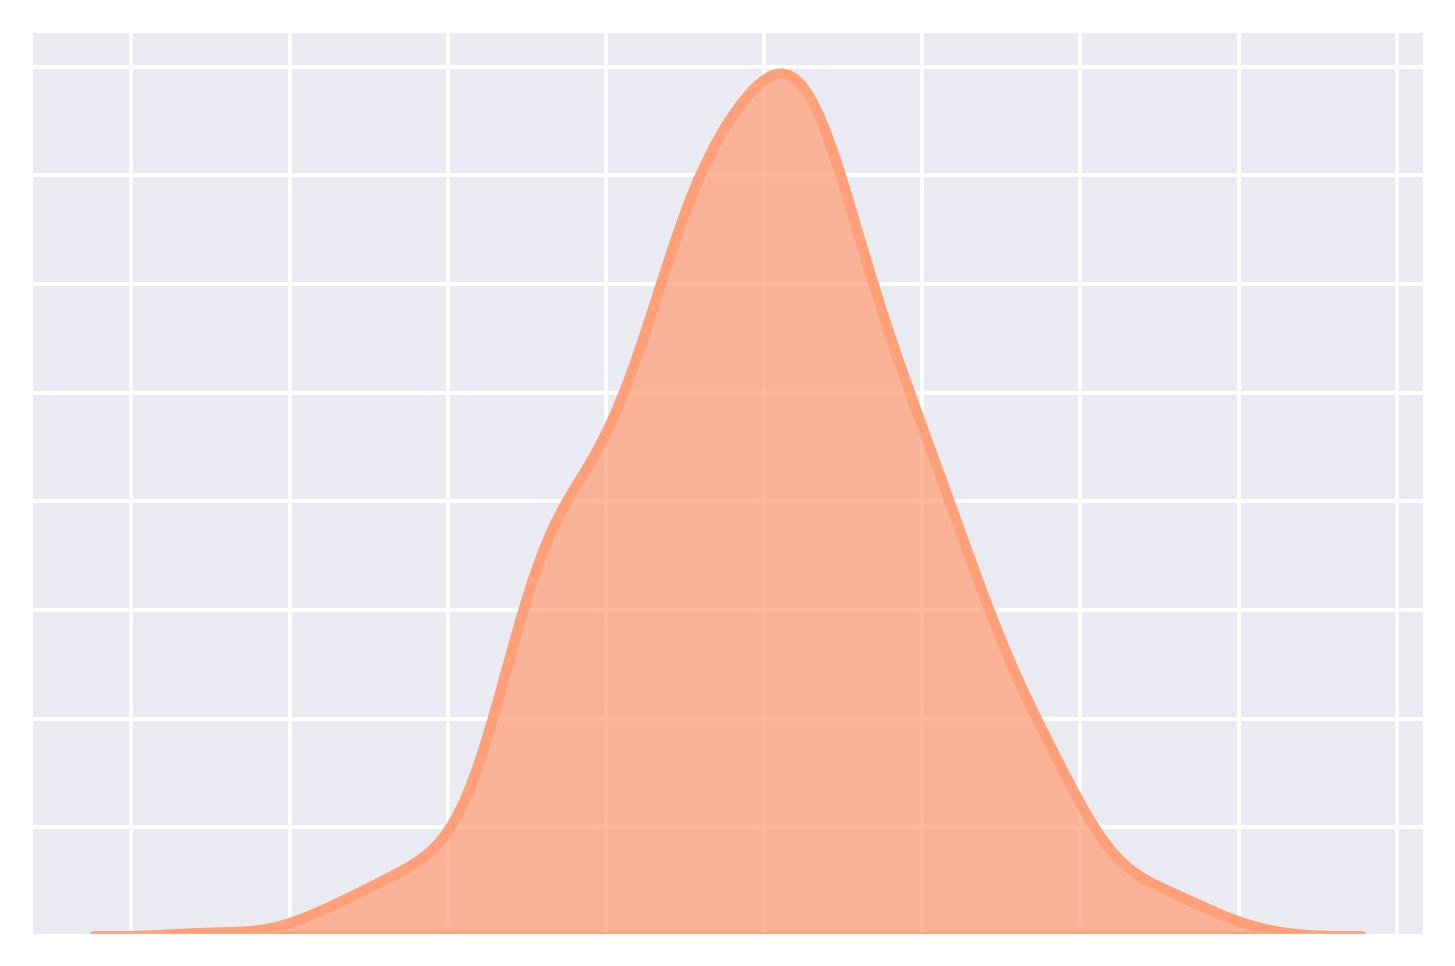
KDE (Kernel Density Estimation) Plot:
It provides a smoothed, continuous representation of the underlying distribution of a dataset.
It represents the data using a continuous probability density function.
Box plot
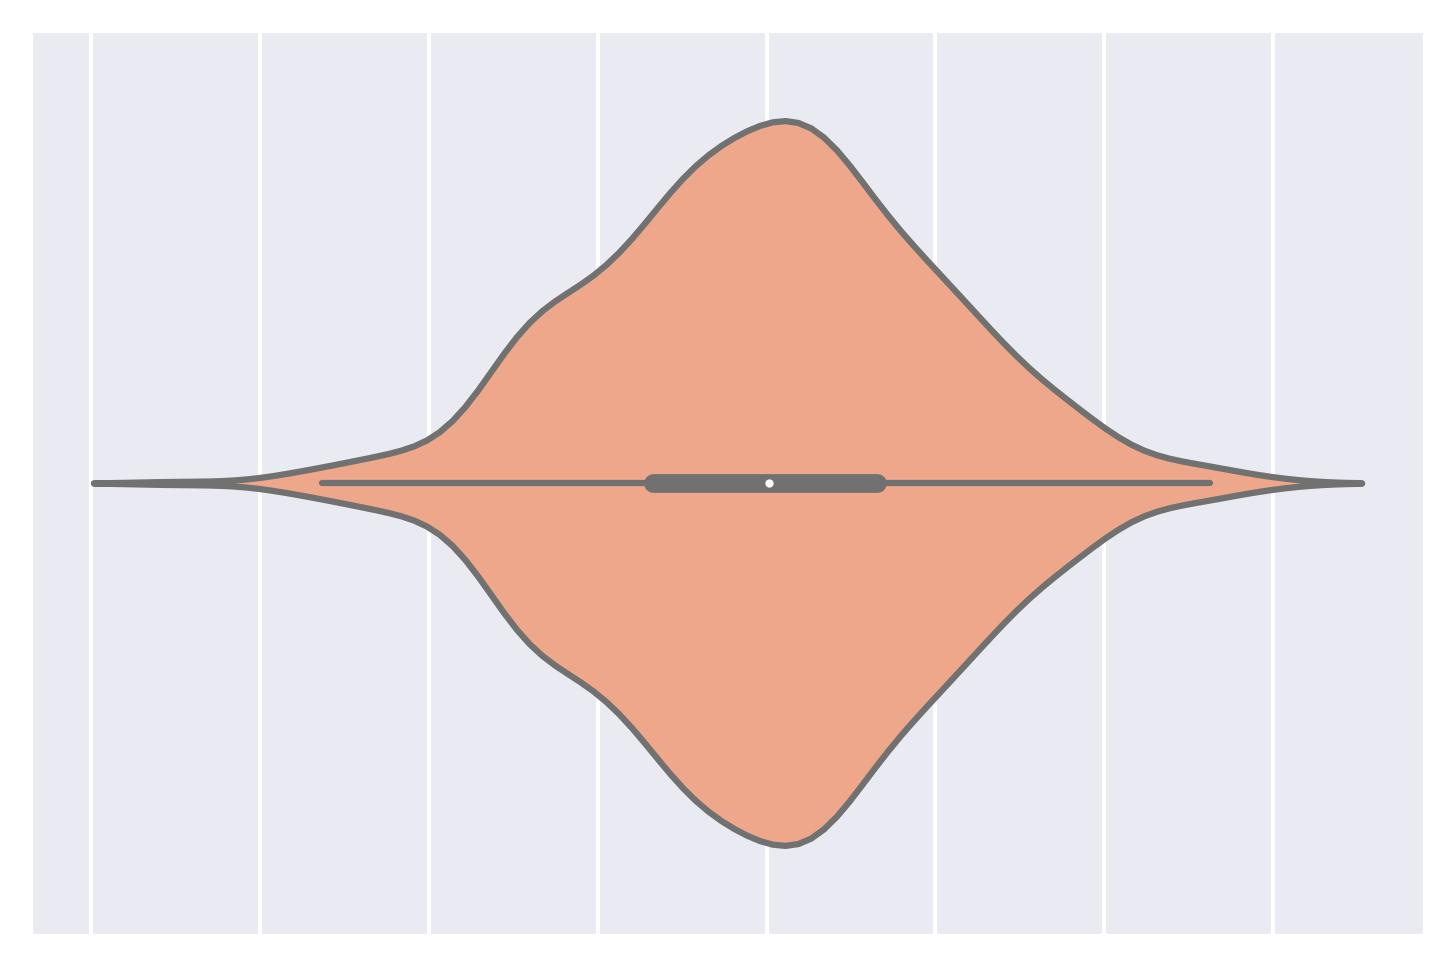
Violin plot:
A combination of a box plot and a KDE plot.
#2) Statistical methods:
While the plotting methods discussed above are often reliable, they offer a subjective method to test normality.
In other words, the approach of visual interpretation is prone to human errors.
Thus, it is important to be aware of quantitative measures as well.
Shapiro-Wilk test:
The most common method for testing normality.
It calculates a statistic based on the correlation between the data and the expected values under a normal distribution.
This results in a p-value that indicates the likelihood of observing such a correlation if the data were normally distributed.
A high p-value indicates the presence of samples drawn from a normal distribution.
Get started: Scipy Docs.
Kolmogorov-Smirnov (KS) test:
The Kolmogorov-Smirnov test is typically used to determine if a dataset follows a specific distribution—normal distribution in normality testing.
The KS test compares the cumulative distribution function (CDF) of the data to the cumulative distribution function (CDF) of a normal distribution.
The output statistic is based on the maximum difference between the two distributions.
A high p-value indicates the presence of samples drawn from a normal distribution.
Get started: Scipy Docs.
Anderson-Darling test
Another method to determine if a dataset follows a specific distribution—normal distribution in normality testing.
It provides critical values at different significance levels.
Comparing the obtained statistic to these critical values determines whether we will reject or fail to reject the null hypothesis of normality.
Get started: Scipy Docs.
Lilliefors test
It is a modification of the Kolmogorov-Smirnov test.
The KS test is appropriate in situations where the parameters of the reference distribution are known.
However, if the parameters are unknown, Lilliefors is recommended.
Get started: Statsmodel Docs.
If you are looking for an in-depth review and comparison of these tests, I highly recommend reading this research paper: Power comparisons of Shapiro-Wilk, Kolmogorov-Smirnov, Lilliefors and Anderson-Darling tests.
👉 Over to you: What other common methods have I missed?
👉 If you liked this post, don’t forget to leave a like ❤️. It helps more people discover this newsletter on Substack and tells me that you appreciate reading these daily insights. The button is located towards the bottom of this email.
👉 Read what others are saying about this post on LinkedIn and Twitter.
👉 Tell the world what makes this newsletter special for you by leaving a review here :)
👉 If you love reading this newsletter, feel free to share it with friends!
👉 Sponsor the Daily Dose of Data Science Newsletter. More info here: Sponsorship details.
Find the code for my tips here: GitHub.
I like to explore, experiment and write about data science concepts and tools. You can read my articles on Medium. Also, you can connect with me on LinkedIn and Twitter.


Other statistical methods to test similarity to various probability distributions, including normal:
D'Agostino's K-squared test https://en.wikipedia.org/wiki/D%27Agostino%27s_K-squared_test
Jarque-Bera test https://en.wikipedia.org/wiki/Jarque%E2%80%93Bera_test
Shapiro–Francia test https://en.wikipedia.org/wiki/Shapiro%E2%80%93Francia_test
Kuiper's test https://en.wikipedia.org/waKuiper%27s_test
Cramér–von Mises criterion https://en.wikipedia.org/wiki/Cram%C3%A9r%E2%80%93von_Mises_criterion