

In today’s newsletter:
4x faster LLM inference engine than llama.cpp.
A model decision is only as safe as the system that executes it.
How LLM inference uses GPU memory.
4x faster LLM inference engine than llama.cpp:
We ran Qwen3.5 9B on a base M5 MacBook Pro using three local inference engines, one at a time.
llama.cpp reached 22.0 tokens/s
MLX reached 25.1 tokens/s
Uzu reached 92.1 tokens/s
This frame shows all three runs side by side:
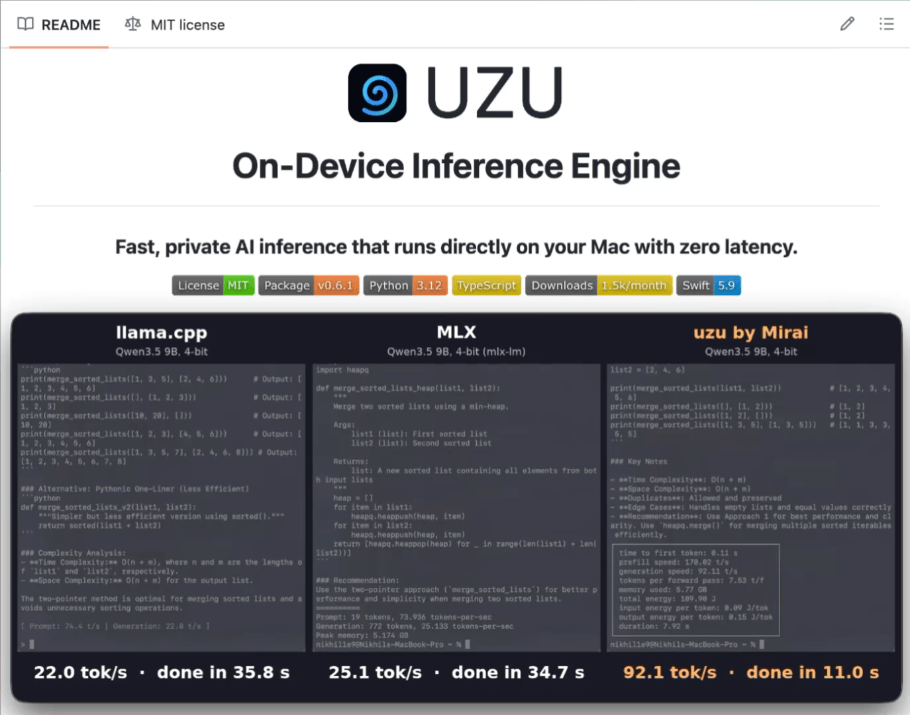
The first two results do not mean llama.cpp or MLX are poorly optimized. Both are approaching a physical limit of ordinary local decoding.
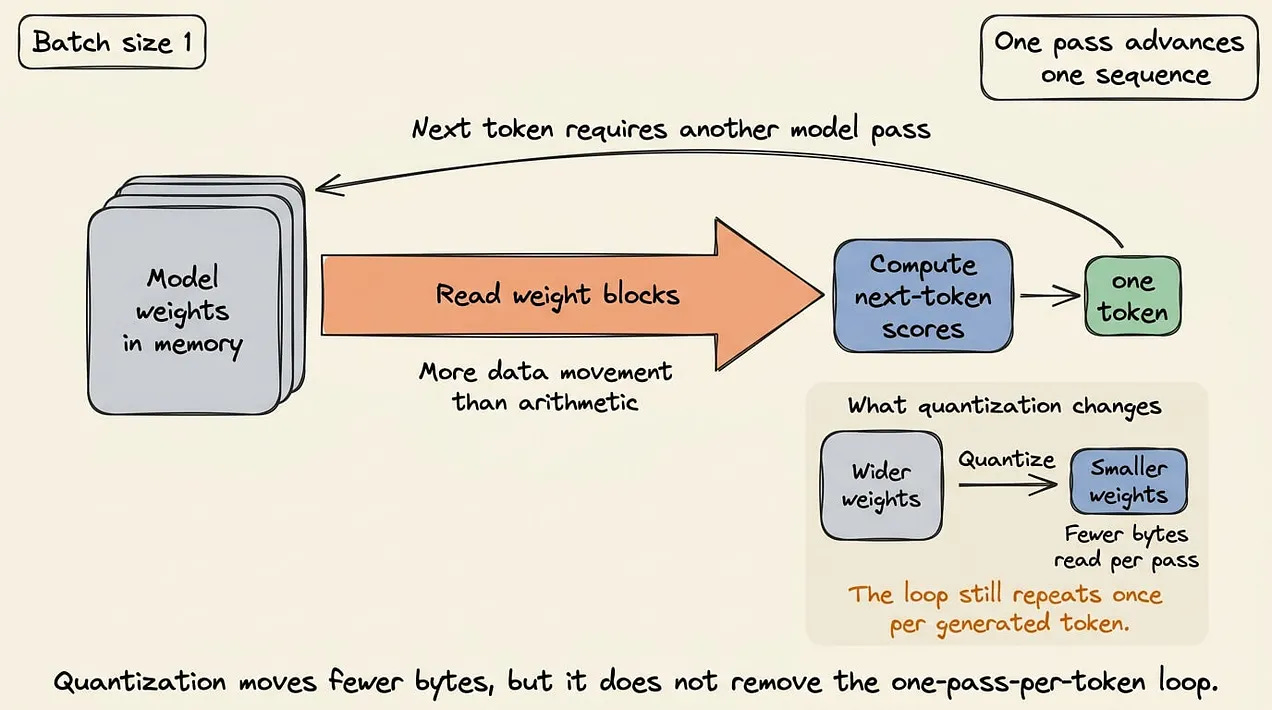
Generating each new token normally requires another pass through the model. That pass streams roughly 5.2 GB of weights through memory.
A base M5 provides about 153 GB/s of memory bandwidth.
At one token per pass, the theoretical ceiling is roughly 153 ÷ 5.2, or 29 tokens/s, however fast the GPU computes.
Uzu gets past that ceiling by optimizing speculative decoding for Apple Silicon.
Speculative decoding uses a smaller drafting system to propose several future tokens. The full 9B model then checks those proposals together instead of generating every token through a separate pass.
Uzu pushes this further in two ways.
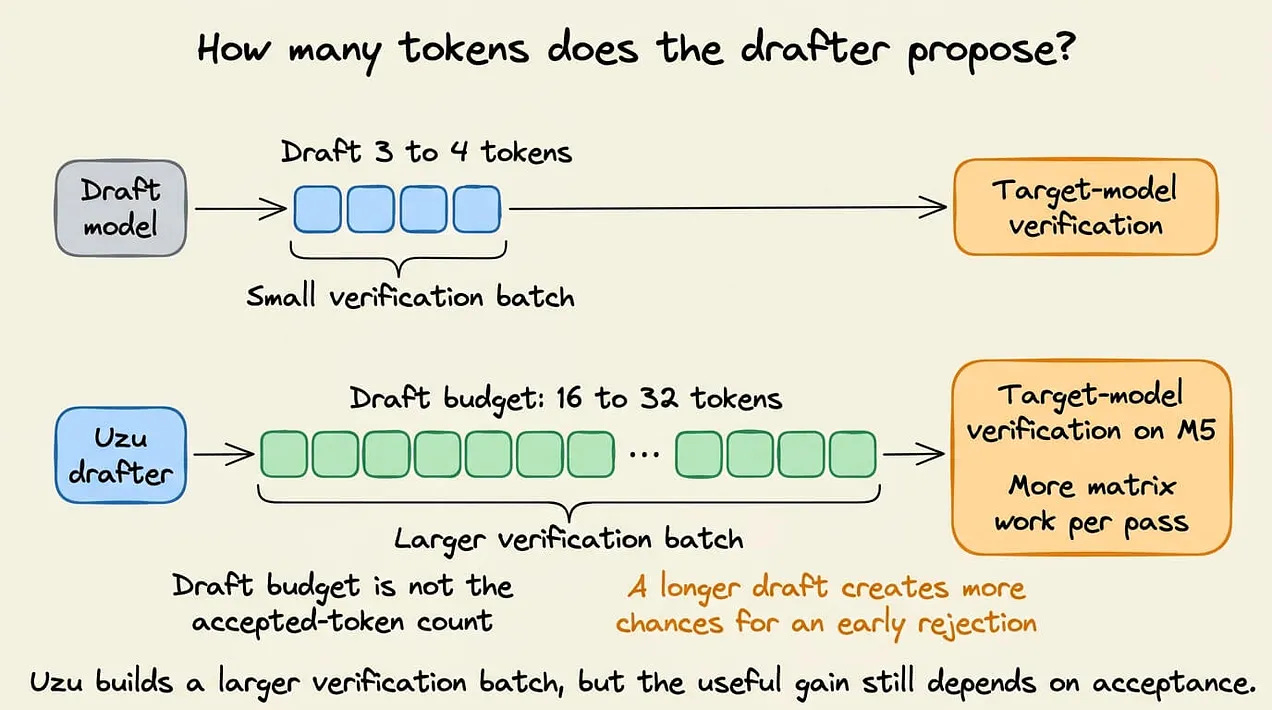
It drafts up to 16 positions and uses Weaver to turn independent guesses into coherent sequences.
It verifies several possible sequences as a tree, then commits state only for the path the full model accepts.
The 9B model remains in control of the final output. Uzu simply gives it more useful work to approve in each pass.
In our run, every pass of the 9B model produced 7.5 output tokens on average.
Ordinary decoding produces exactly 1.
That is how Uzu reached 92.1 tokens/s on hardware whose one-token-per-pass ceiling is roughly 29.
The rest of the engine is designed around this path too. Uzu ships its own quantized checkpoints, and on M5 chips its Metal kernels run verification through the GPU’s accelerated int8 matrix path.
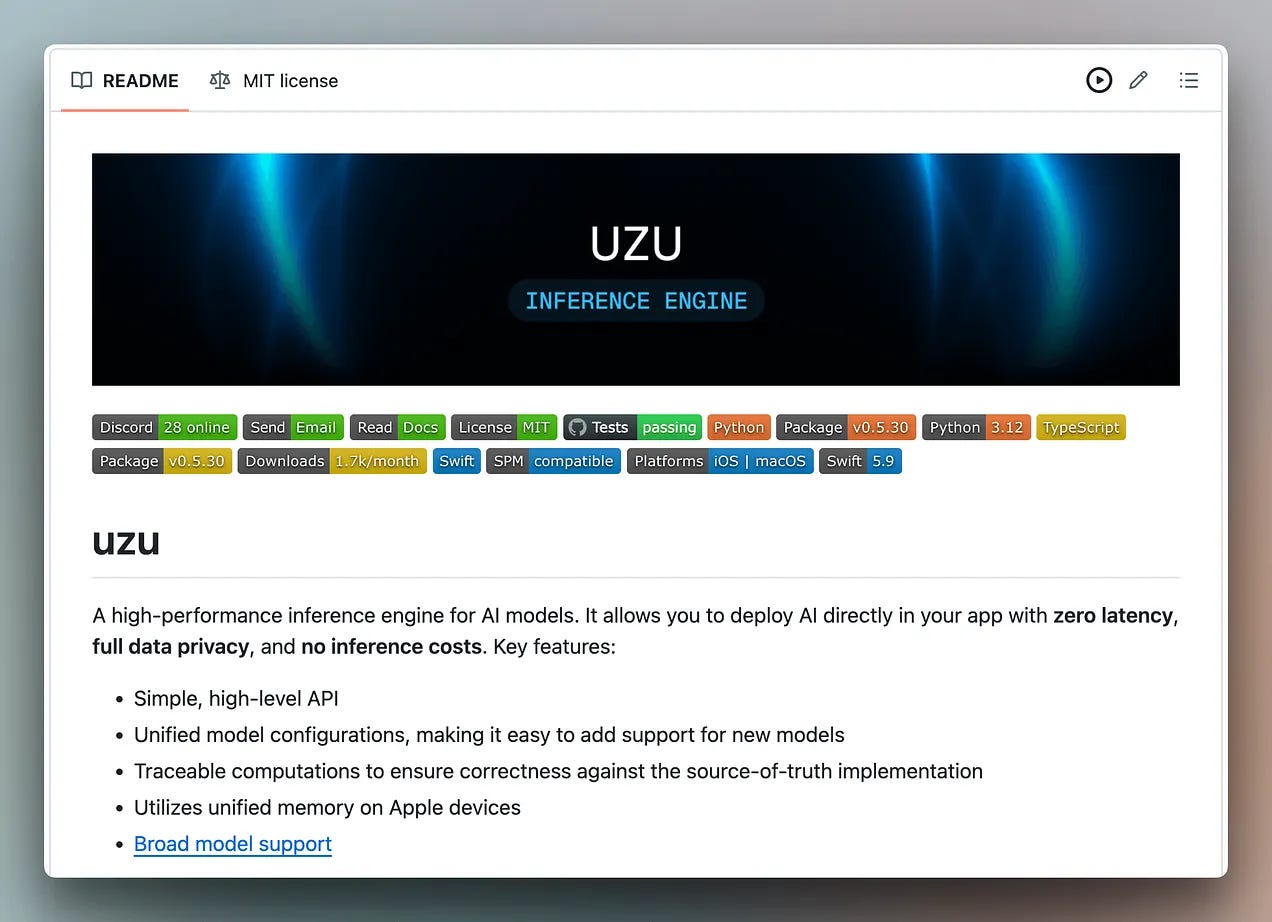
It is an open-source inference engine from Mirai, with bindings for Rust, Swift, Python, and TypeScript.
The repository is here: https://github.com/trymirai/uzu
(don’t forget to star 🌟)
A model decision is only as safe as the system that executes it
Jev reached nearly 13% of paid teams on Vercel AI Gateway in its first 24 hours, more than double the share for any previous model launch.
Unlike other models, Jev does not write an open-ended response, and instead selects from a defined set of choices. You provide the choices and the current application state, and it returns a selected choice and a probability for each option.
The interesting part here starts after that response returns. For an incident-response agent, that could mean deciding whether to page a team, gathering more evidence, or handing off control to a human.
We used Claude Code to build the agent. It produced 30 files and 3,383 lines covering the model client, policy engine, agent loop, tools, API, dashboard, fixtures, and tests.
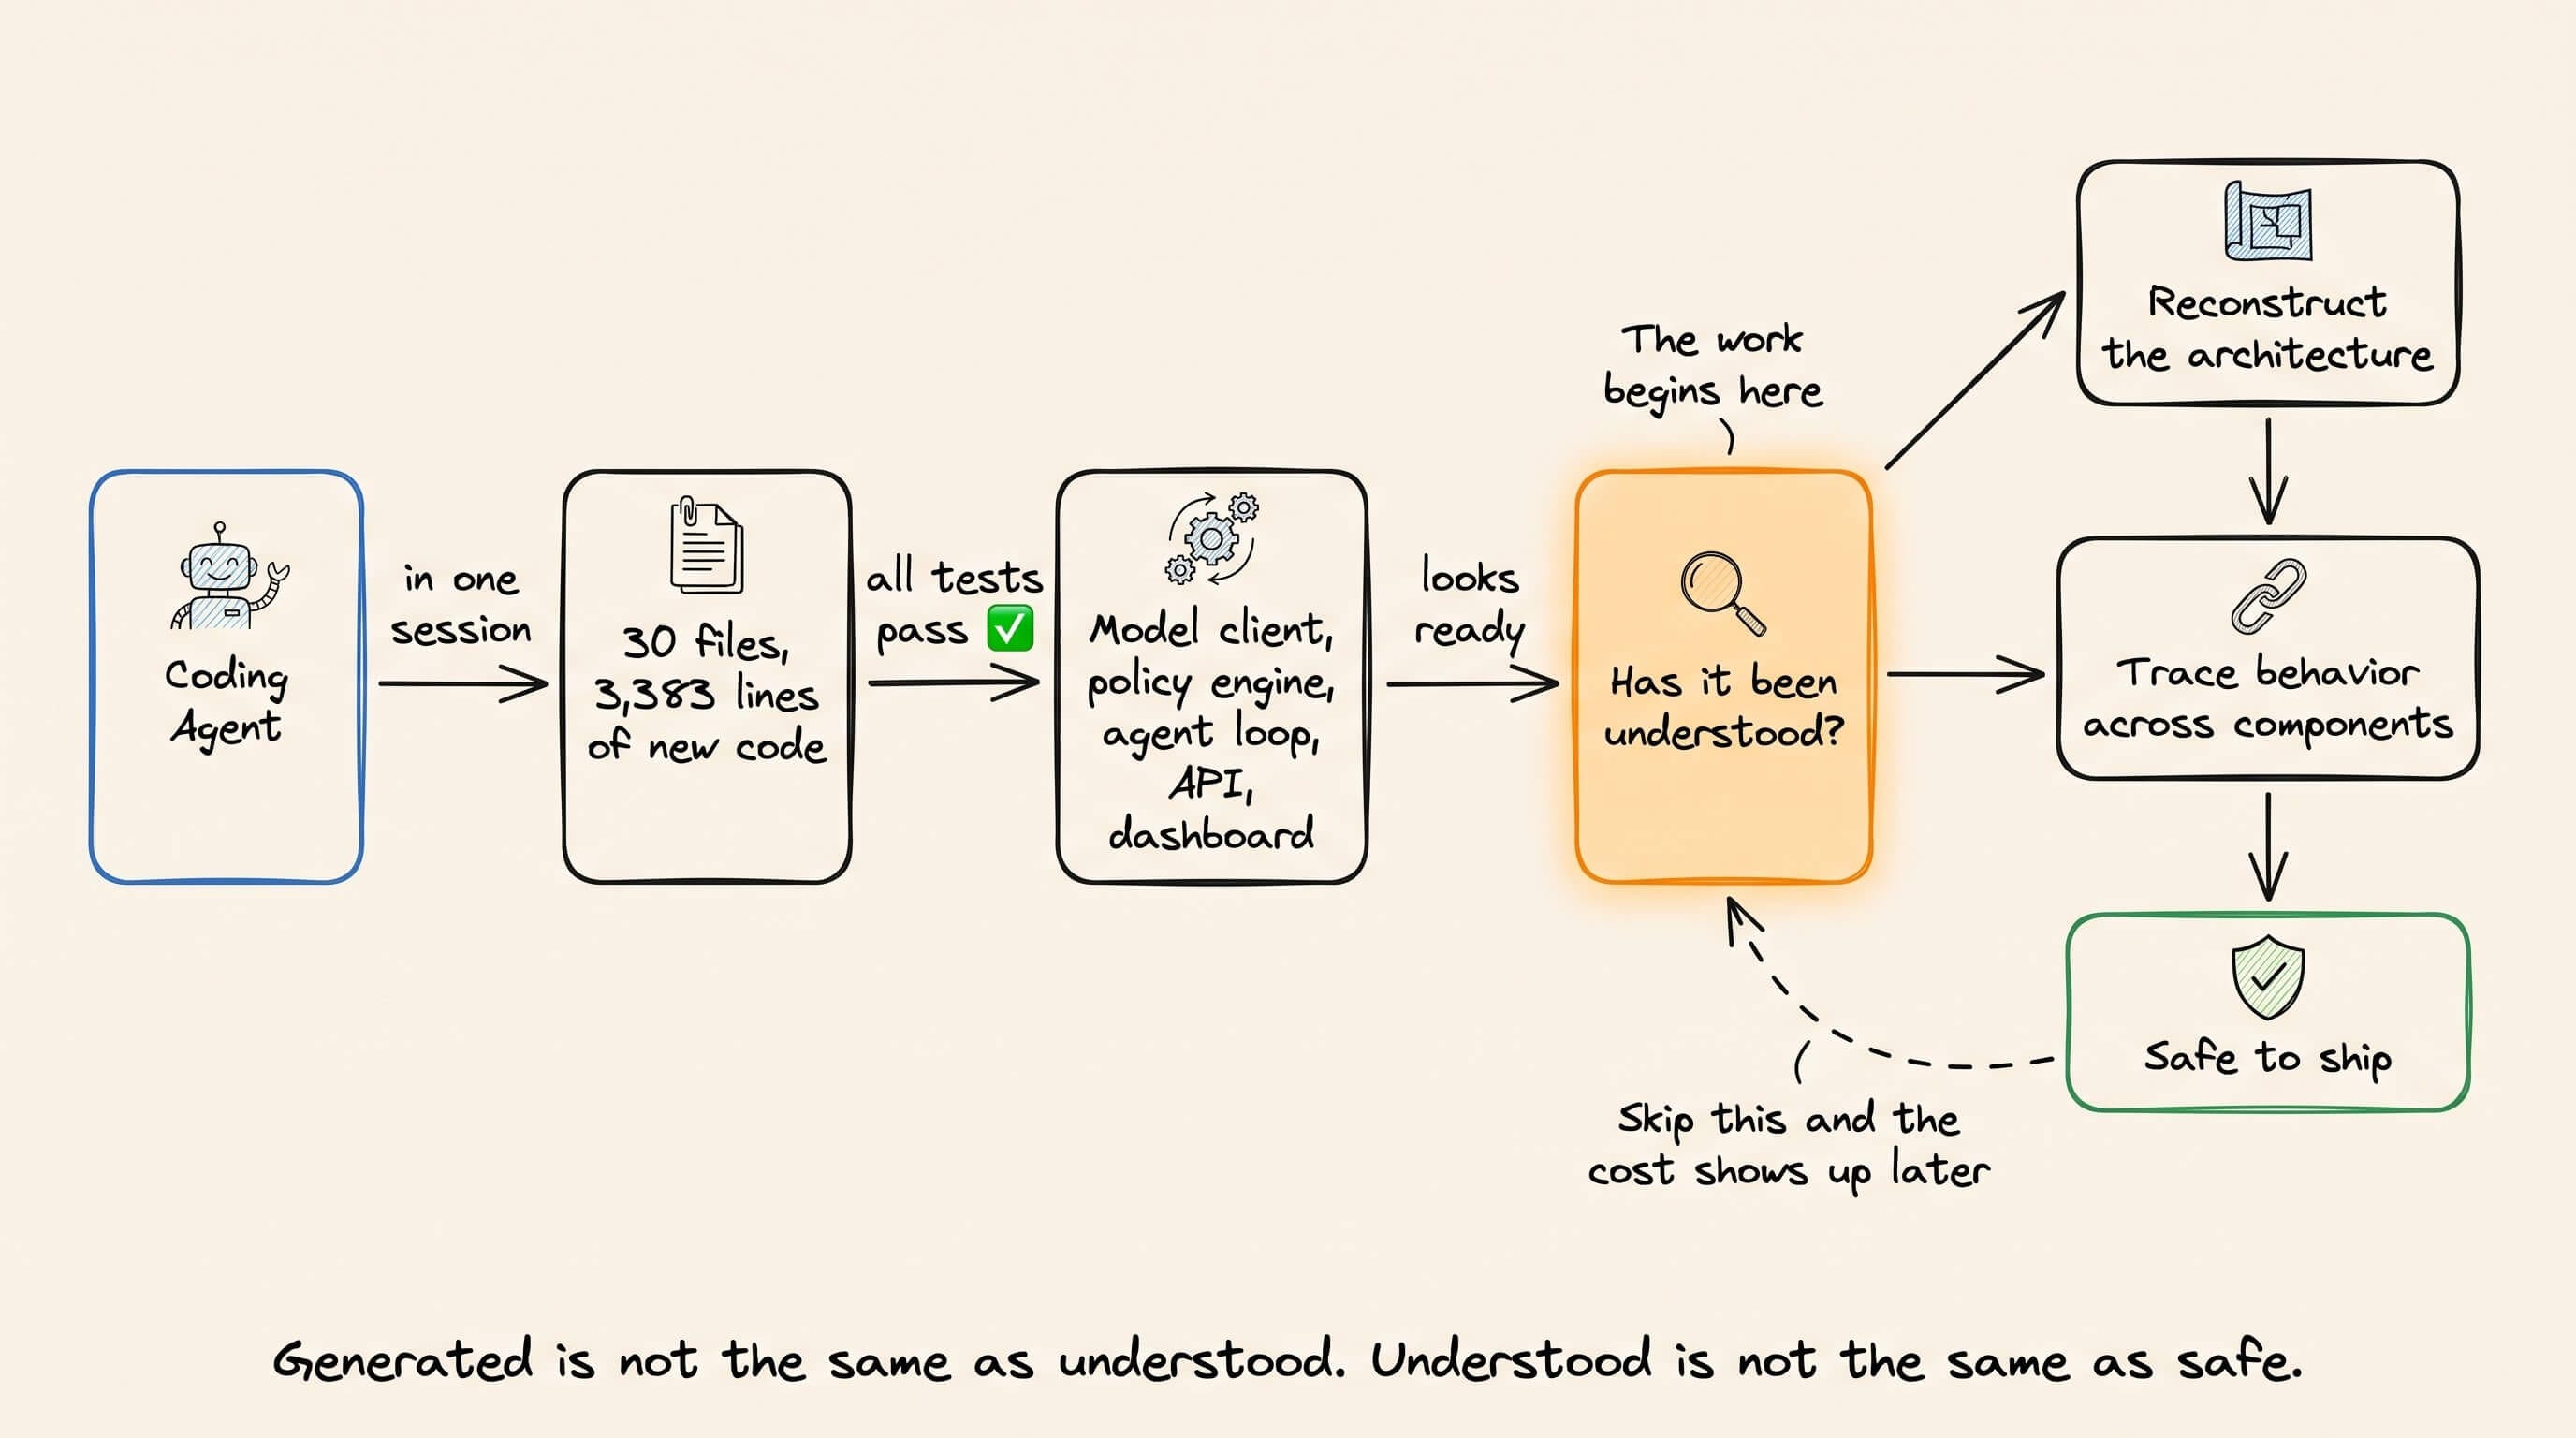
The application ran, all 46 tests passed, and the feature looked complete at first glance. Before merging, we still needed to review how those pieces worked together.
That’s where CodeRabbit comes in. As the governance and control layer for agentic software development, it helps developers understand and validate what their agents build so they can ship with confidence.
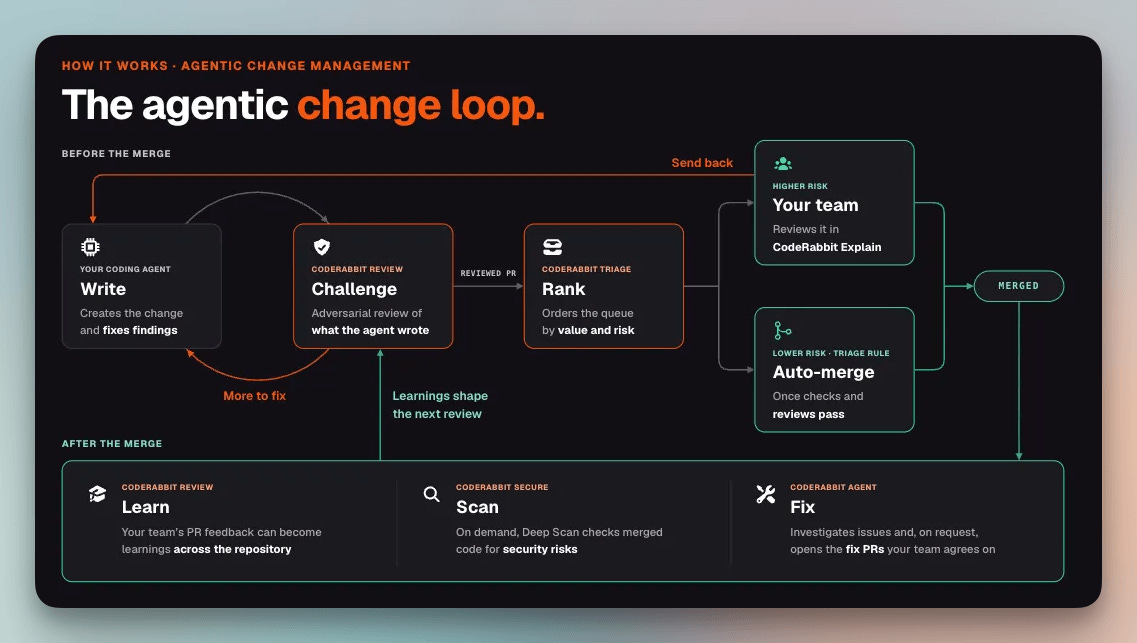
It organizes a large pull request into its logical architecture, identifies the paths that deserve attention, and reviews behavior and security across the full change rather than one file at a time.
Before looking at what it found, let’s look at the agent Claude Code built.
The incident-response agent
Incident response gives the model a constrained set of choices, each with consequences.
Paging the wrong team interrupts people and can delay the actual response.
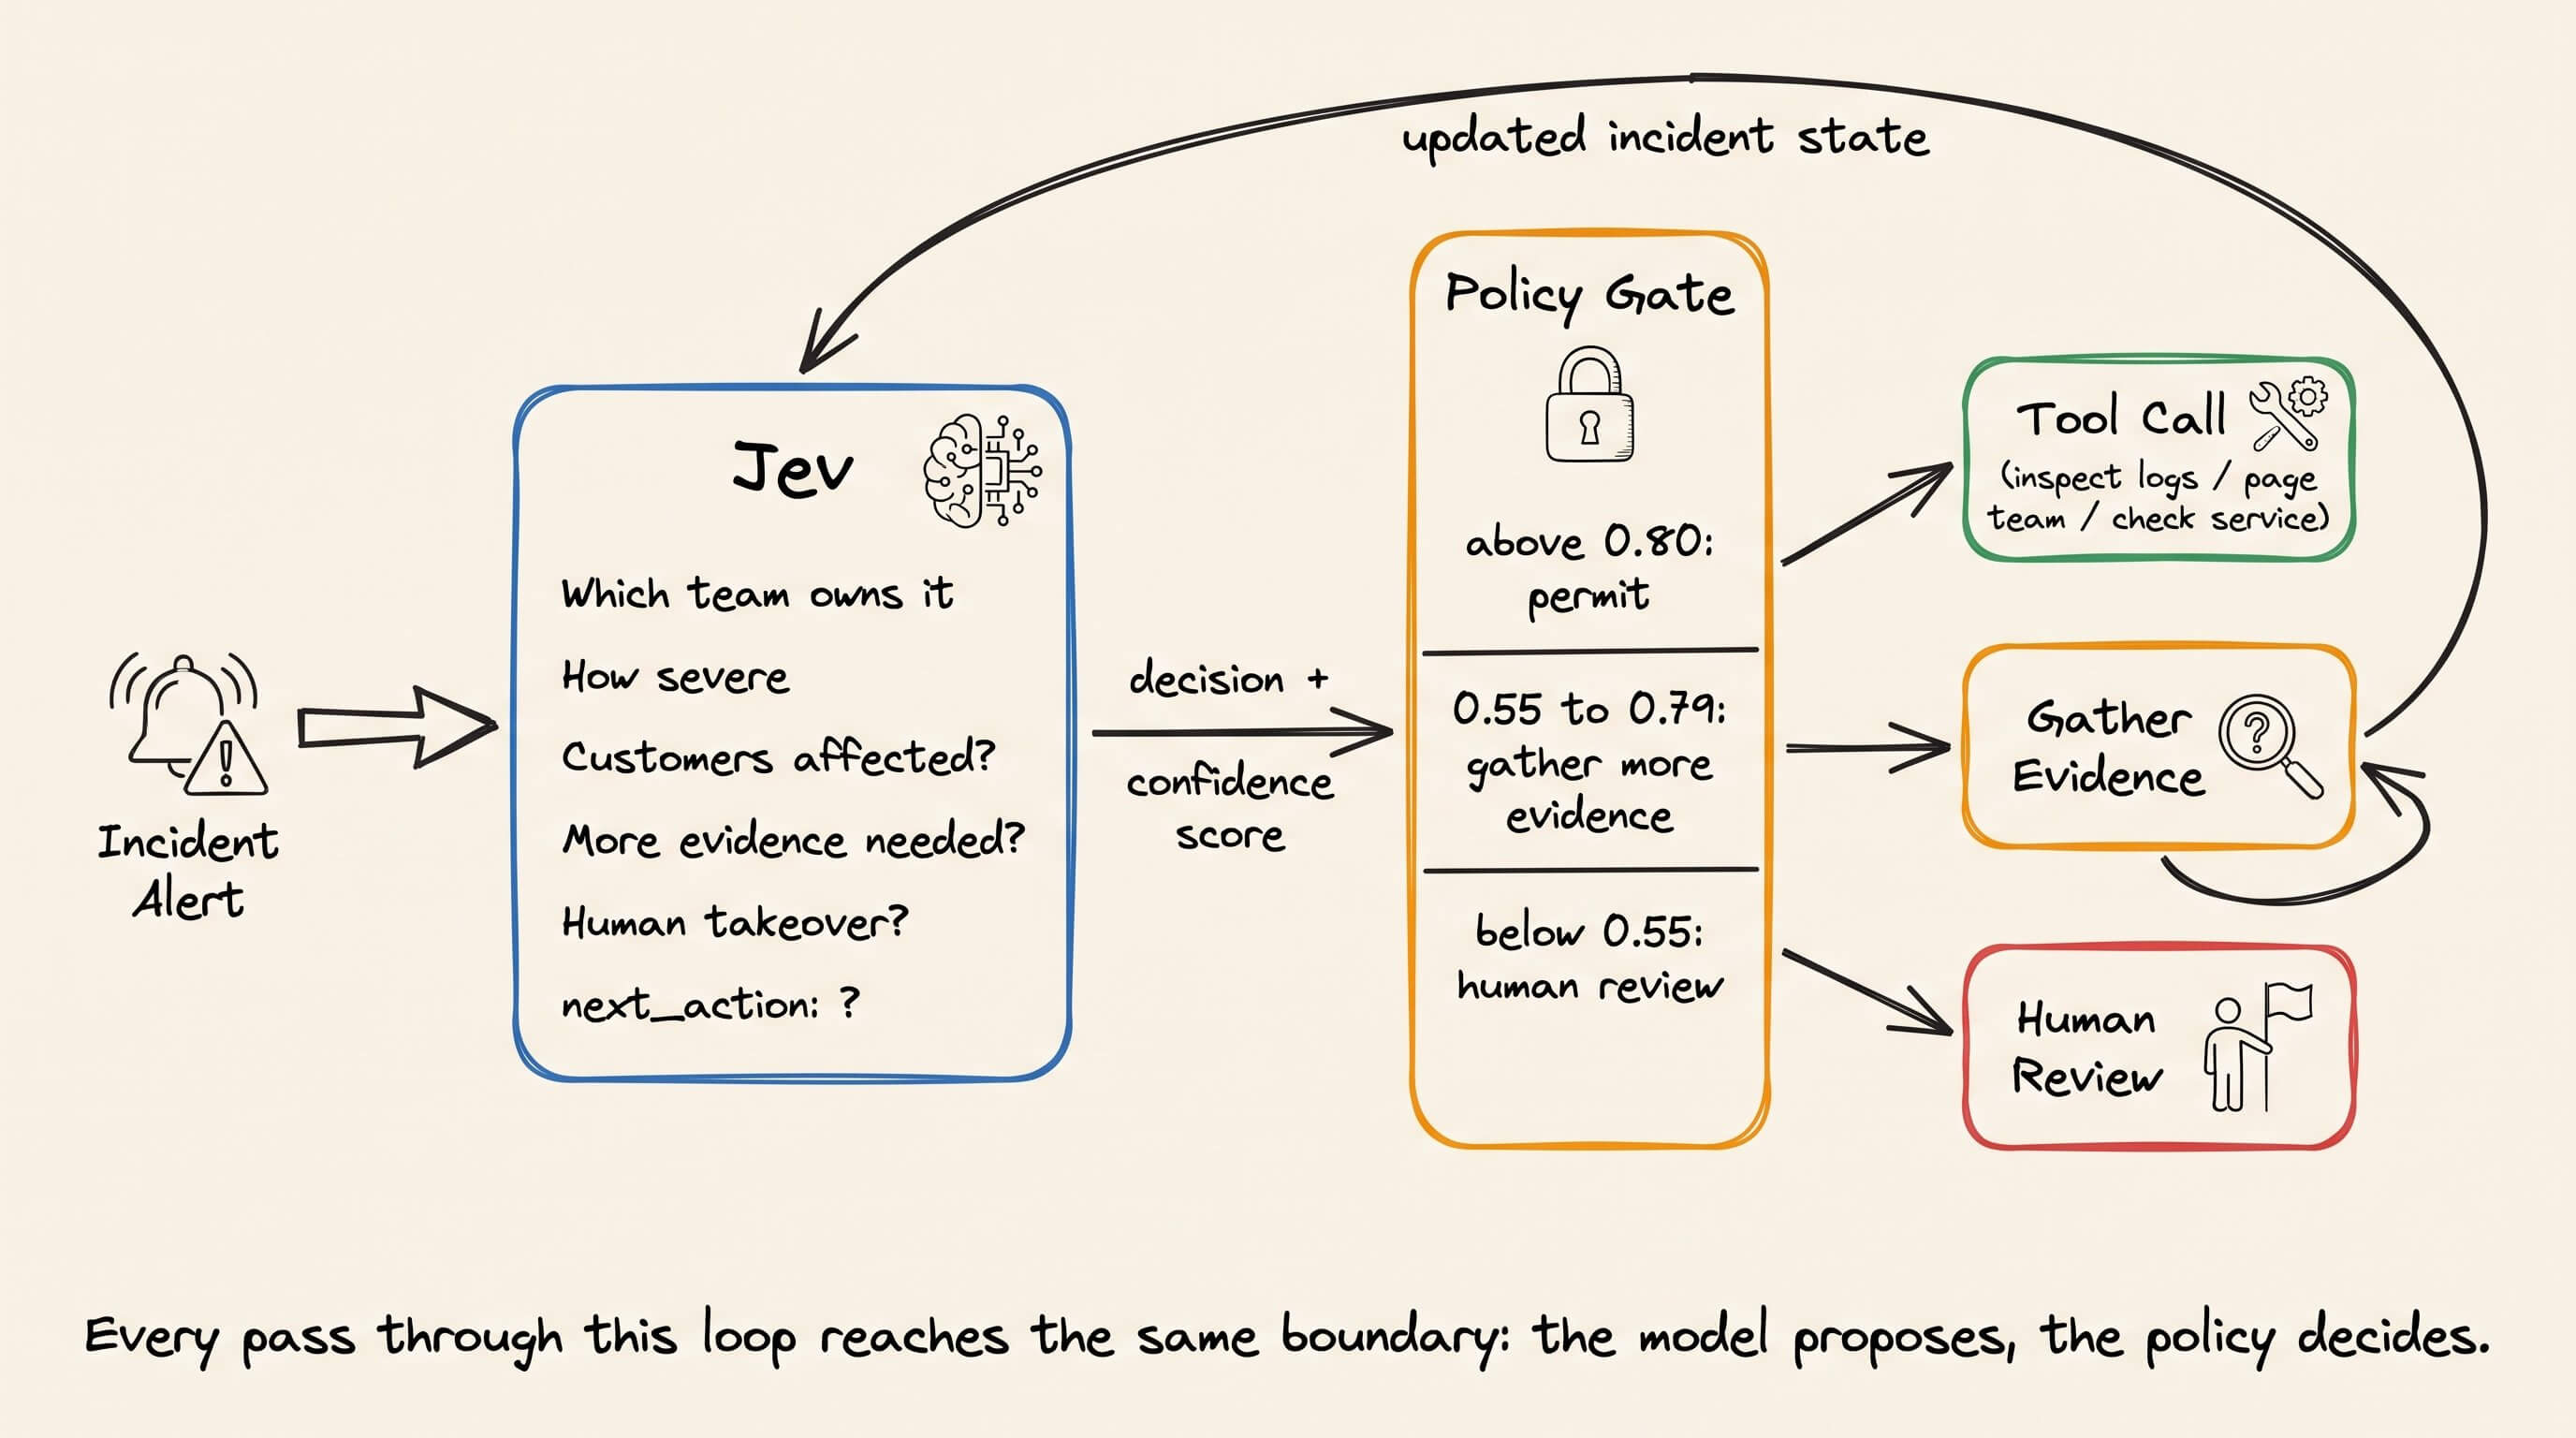
We wanted the application to record each dev decision, its confidence, the available evidence, and any handoff to a human.
We gave Claude Code a single prompt with those requirements and let it build the application.
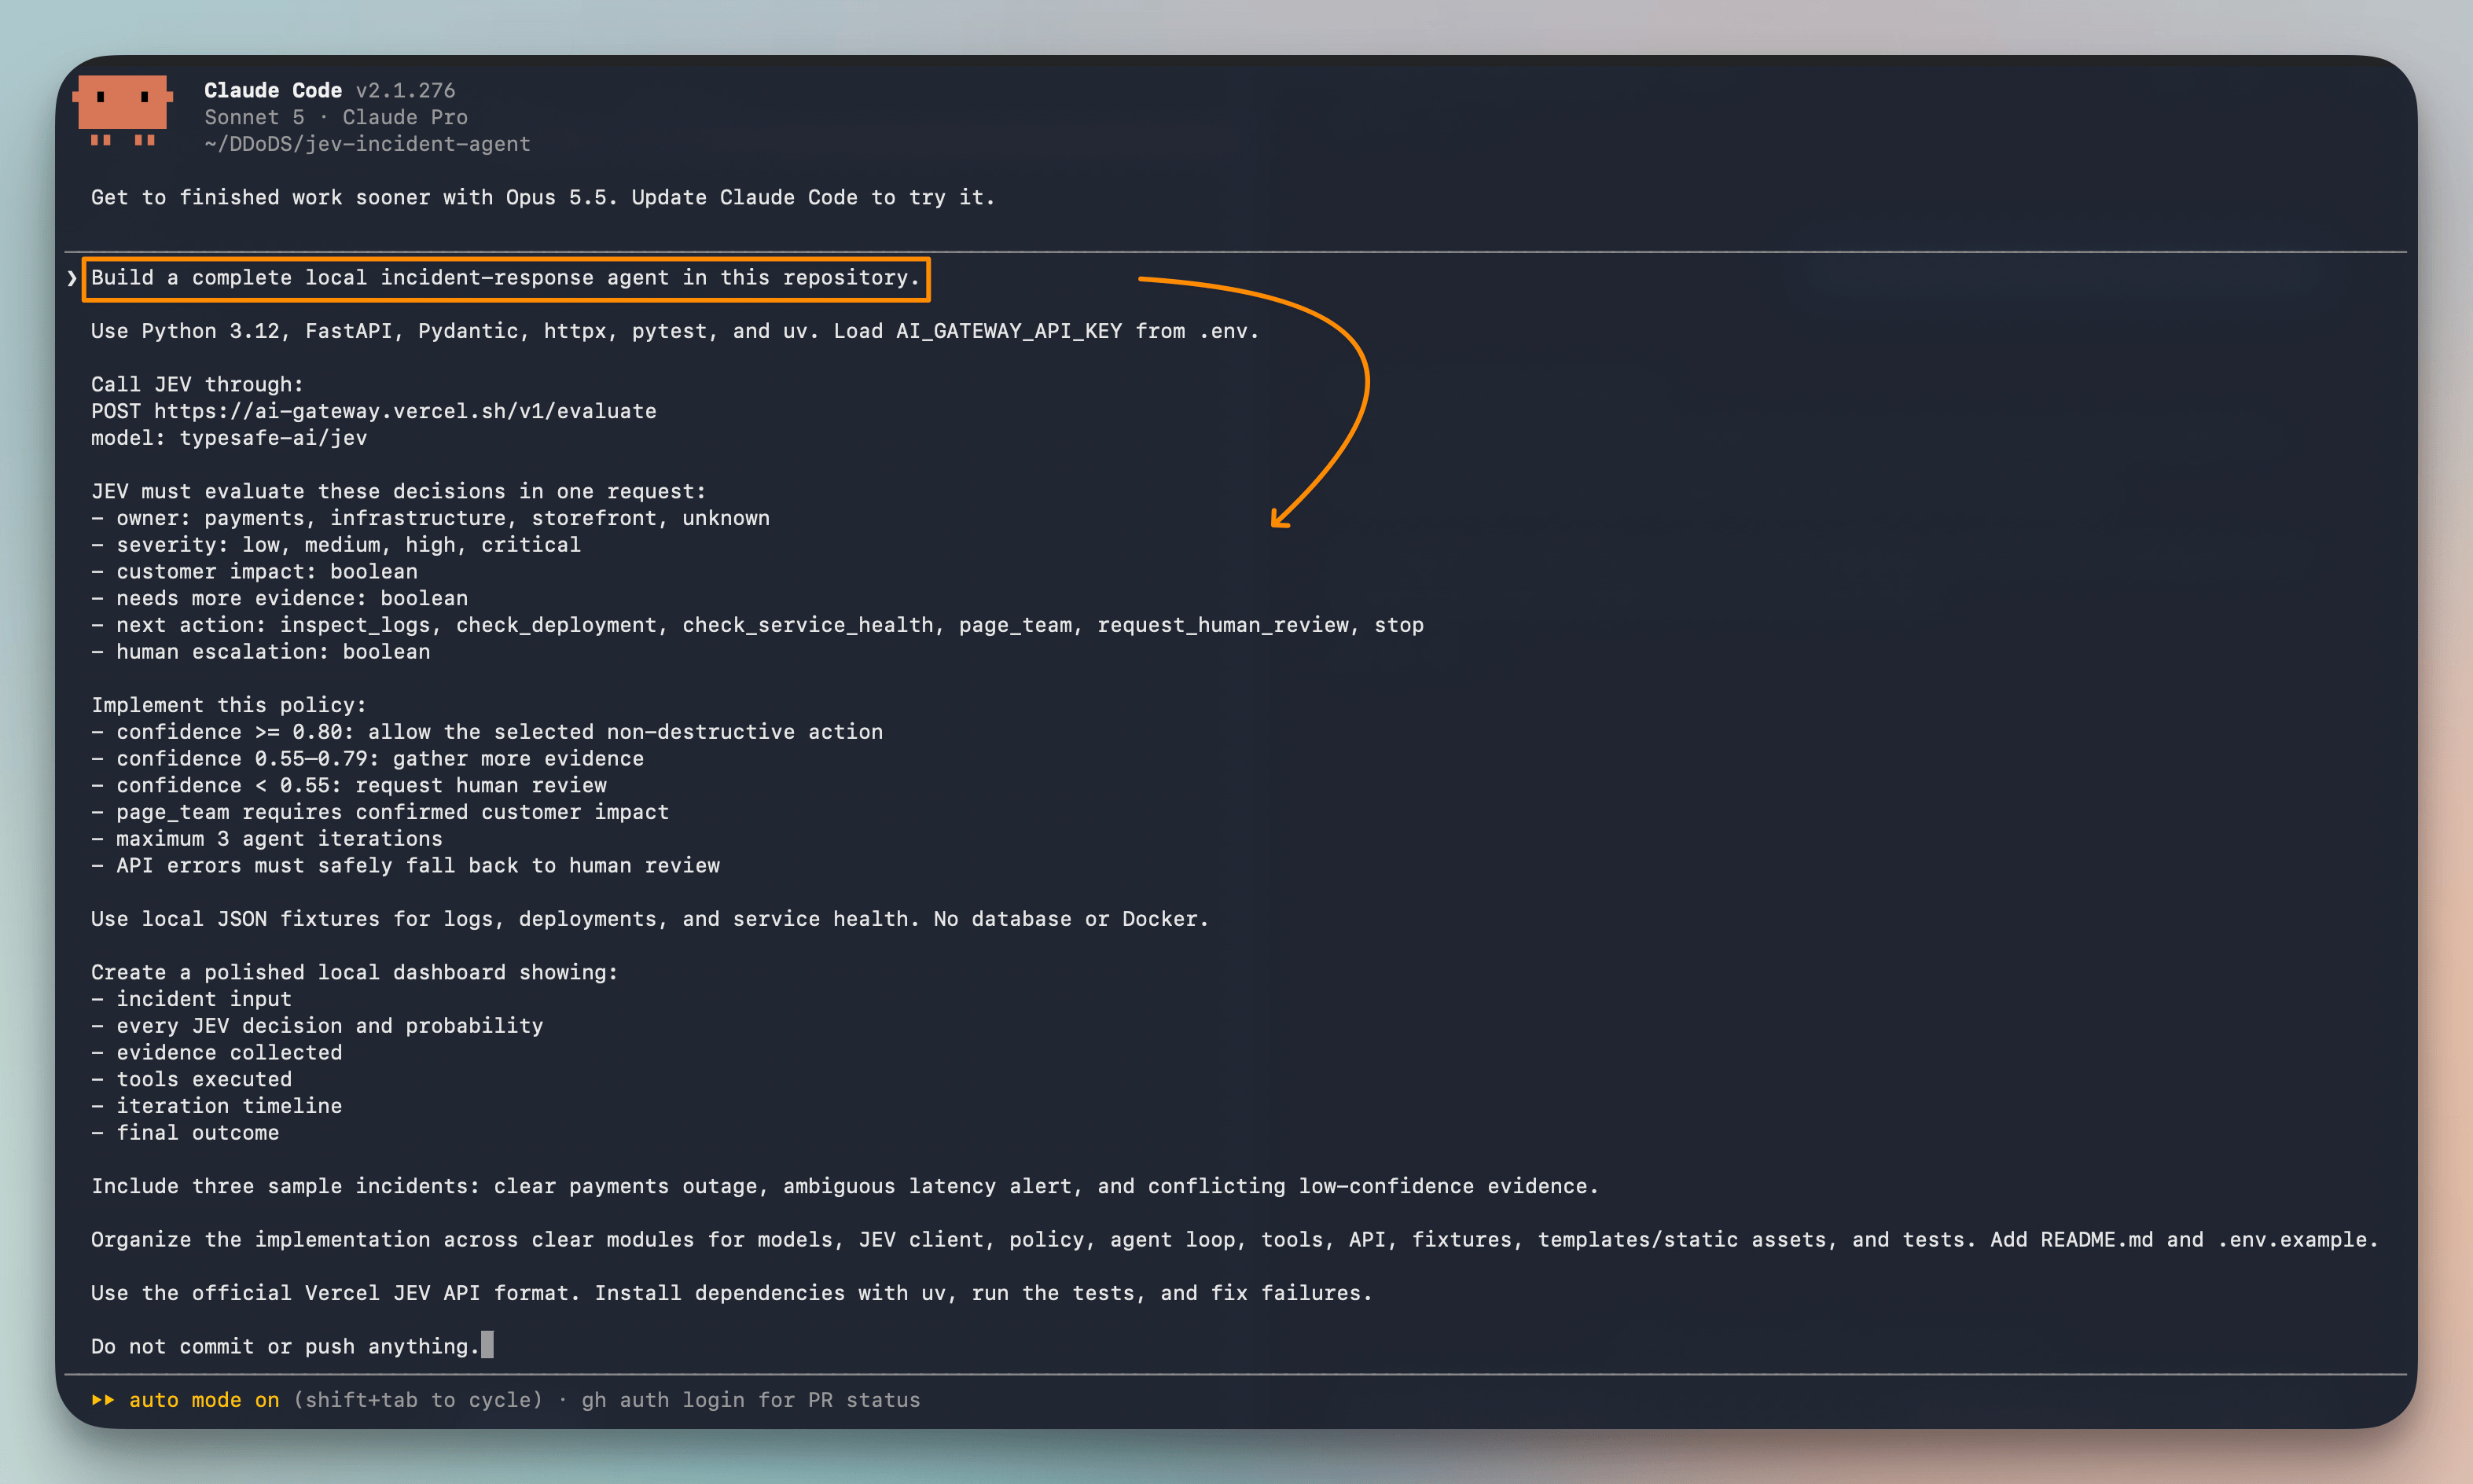
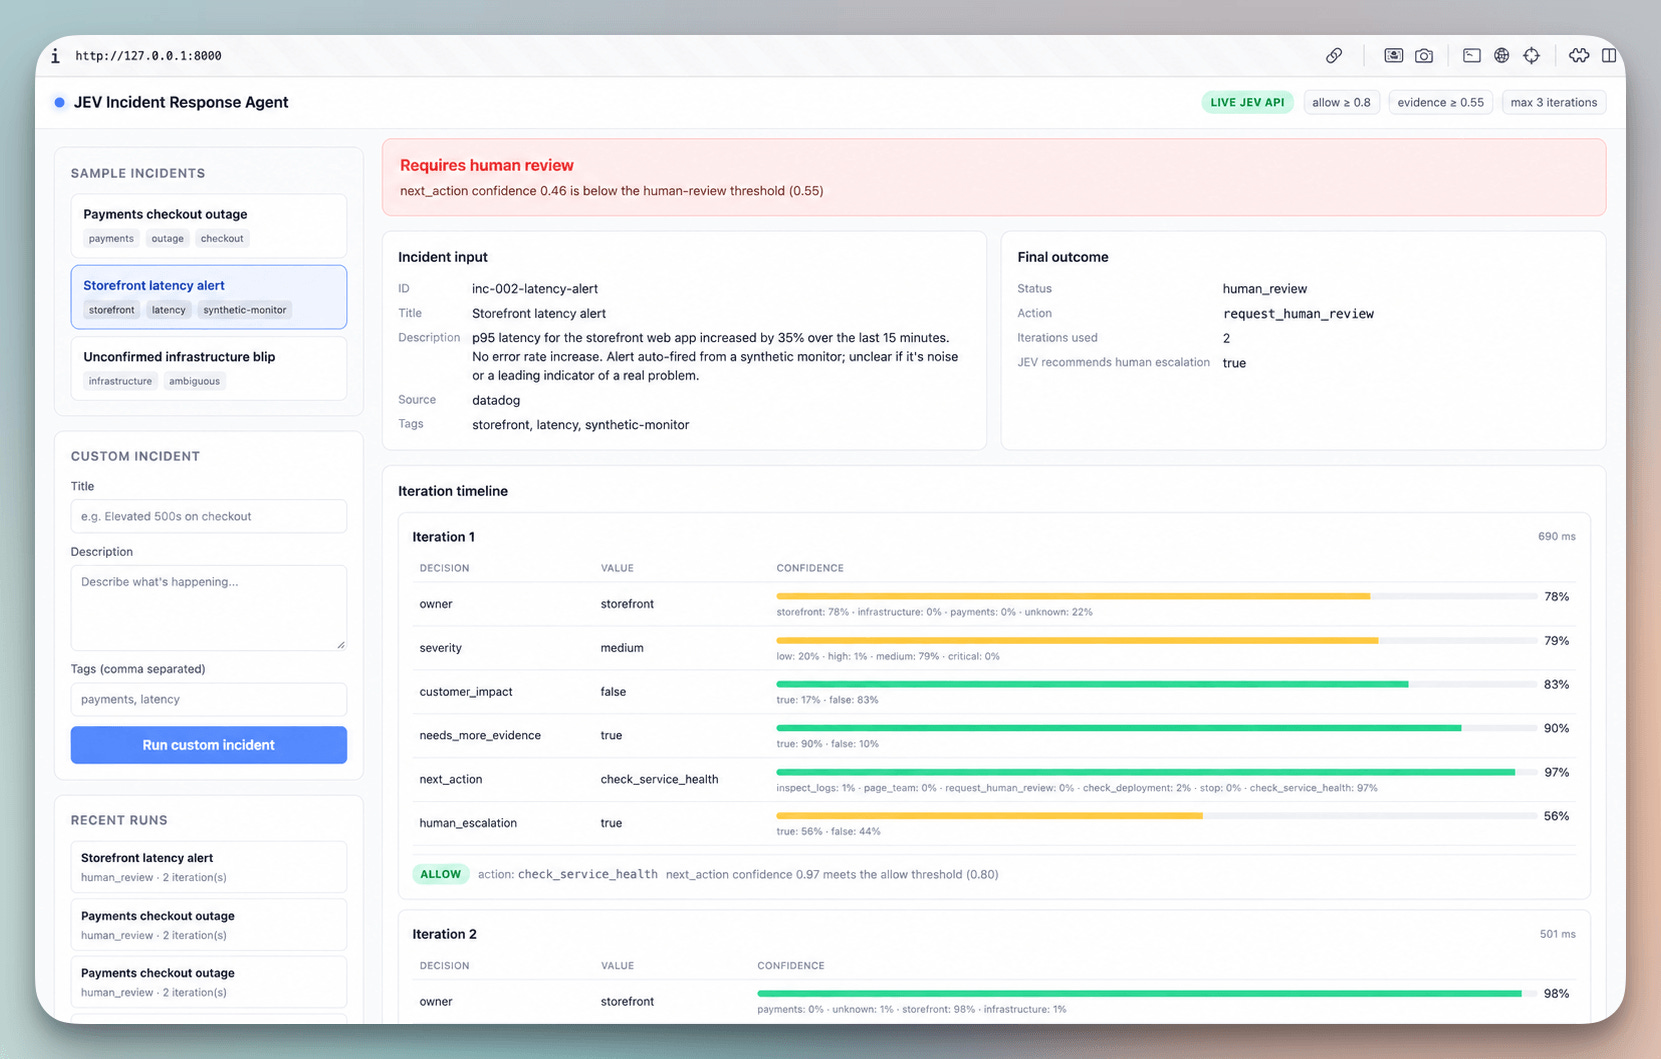
The generated dashboard showed every Jev answer, its probabilities, the tools executed, and the final outcome.
That makes the boundary between model judgment and application policy visible during the run.
The agent starts with an alert. Jev receives the current incident state and answers six questions in one request:
Which team owns the incident?
How severe was the incident?
Whether customers are affected?
Whether more evidence is needed?
Whether a human should take over
What should the agent should do next (
next_action)?
The last answer, next_action is restricted to six values: inspect logs, check a deployment, check service health, page a team, request human review, or stop.
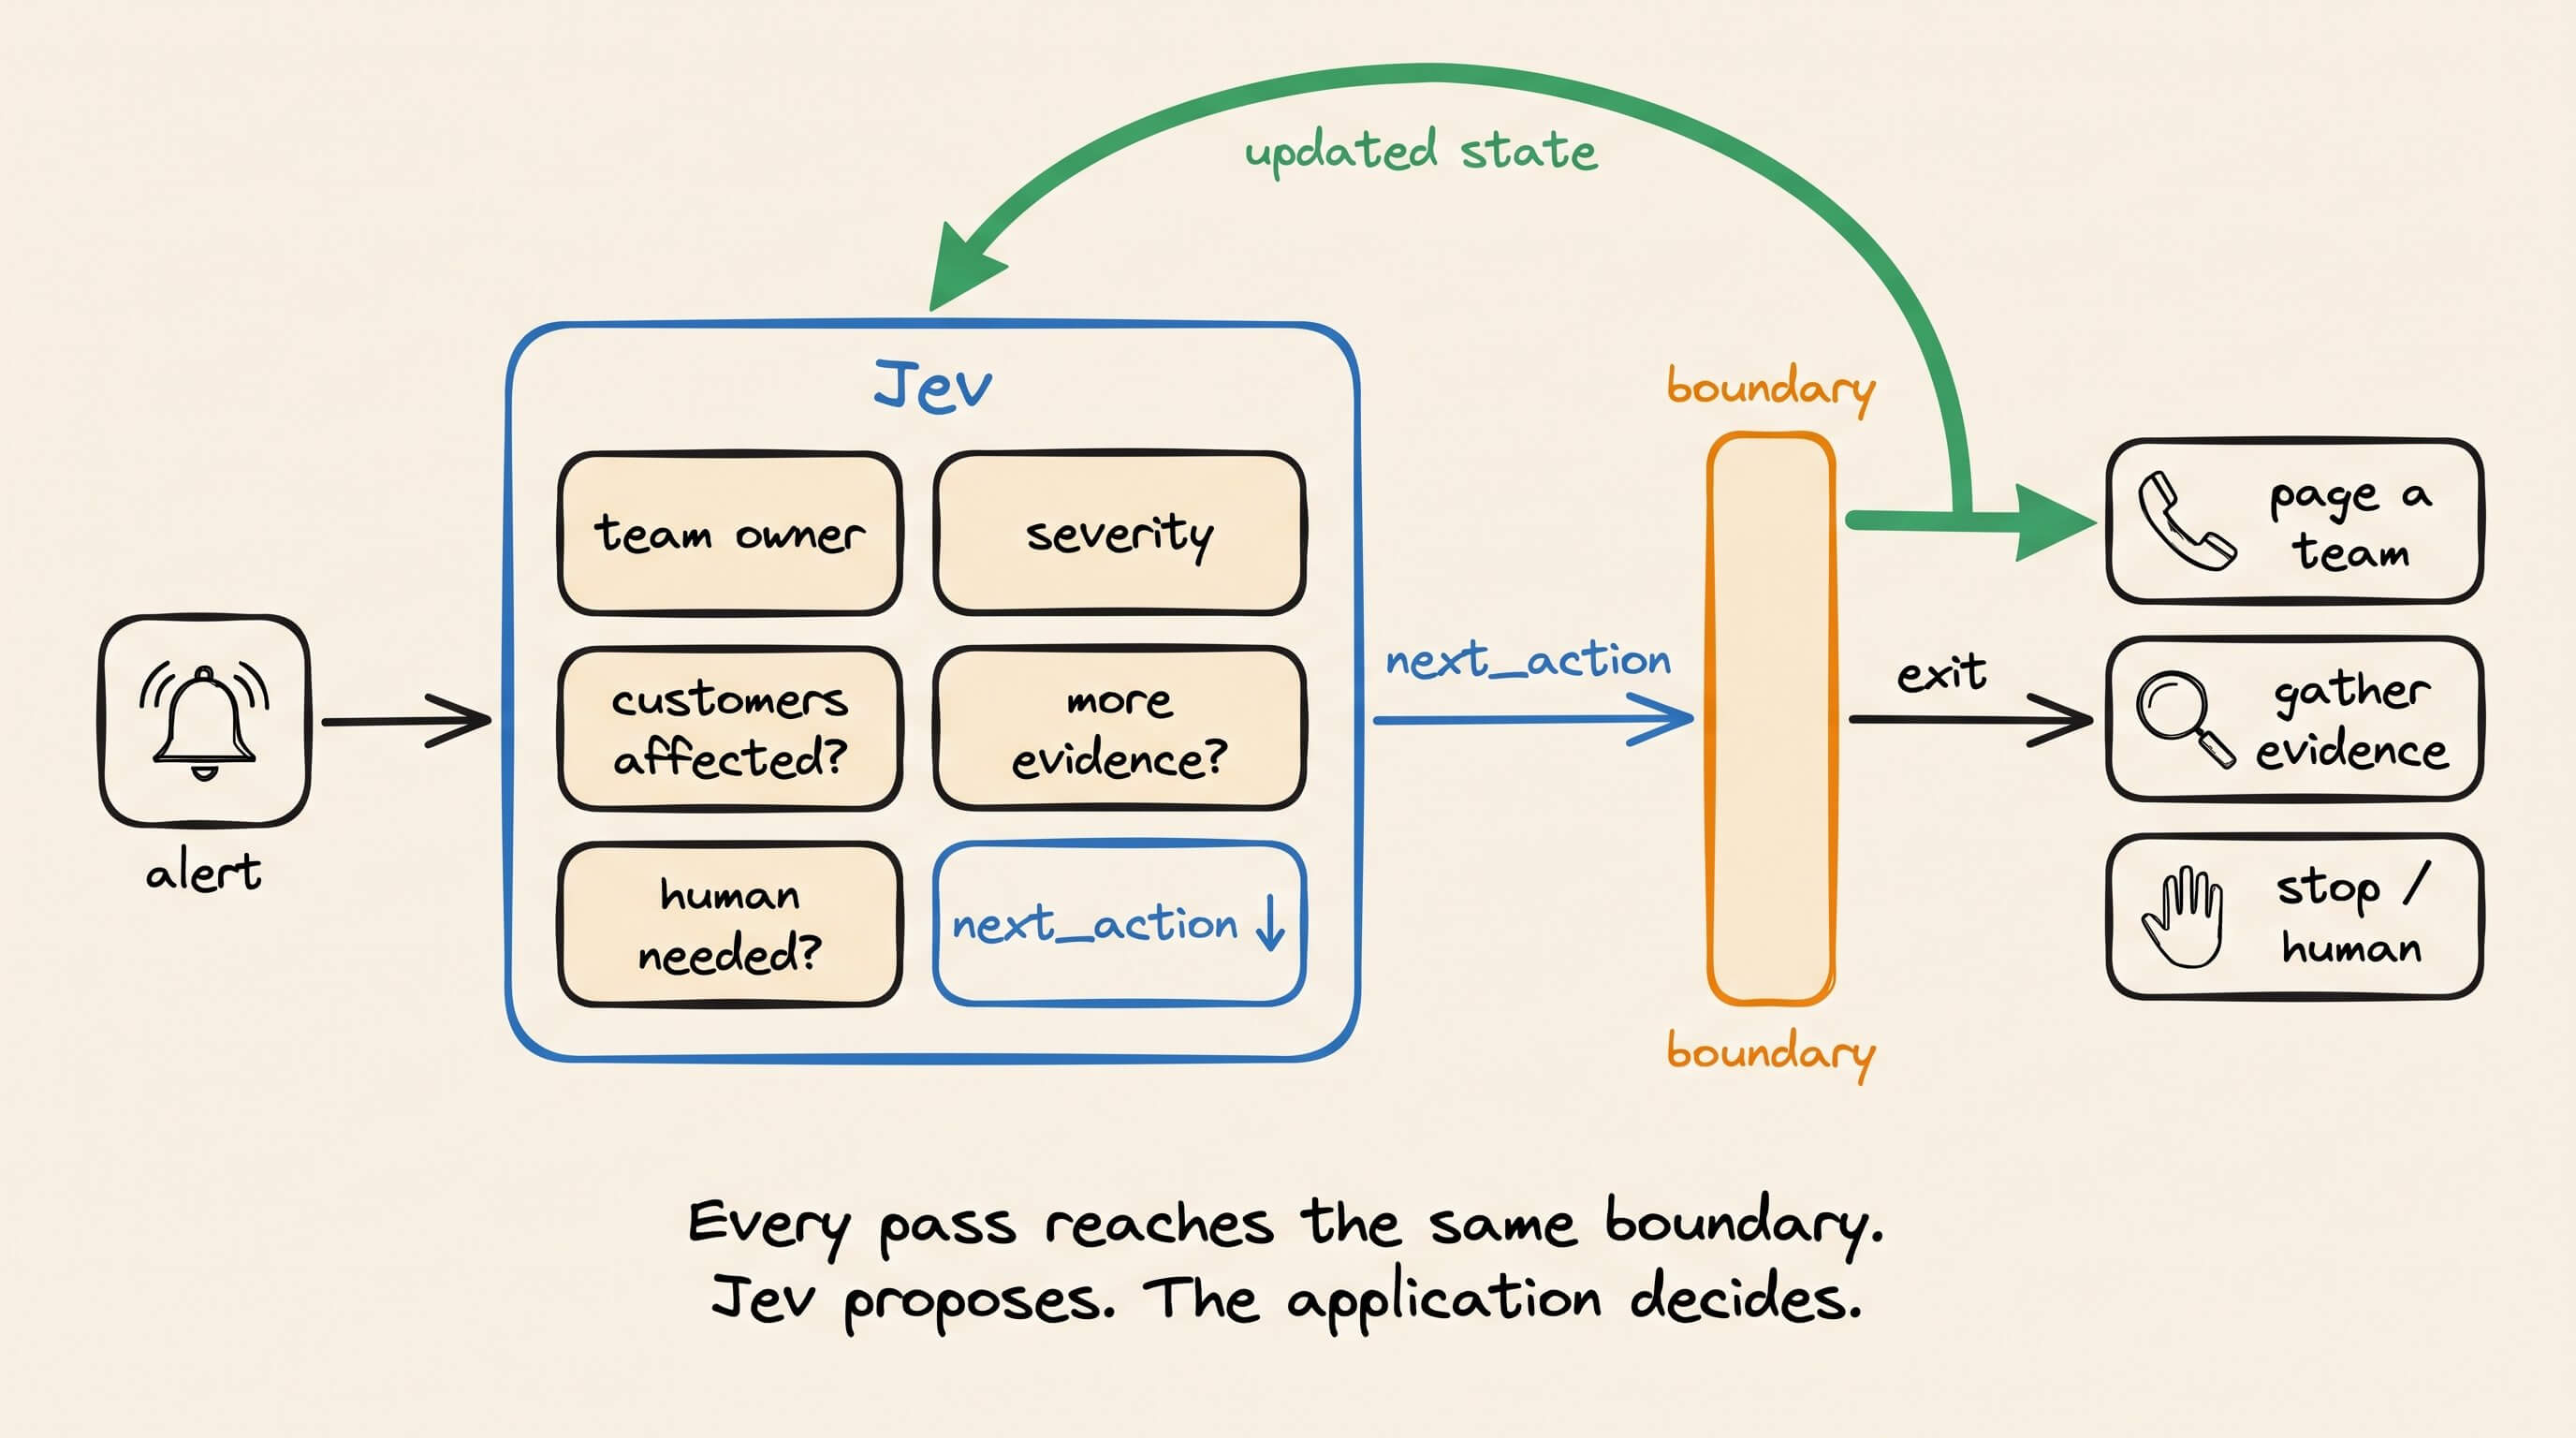
When the agent gathers evidence, it adds the result to the incident state and sends the updated state back to Jev.
It reads from local JSON fixtures, which keeps each run reproducible and prevents it from touching a production service.
Every pass through this loop reaches the same boundary, where Jev proposes next_action and the application decides whether that action can become a tool call.
The policy gate
The policy uses the probability assigned to the selected action:
At 0.80 or above, it permits the action.
From 0.55 to 0.79, it gathers more evidence.
Below 0.55, it transfers control to a human.
A page_team recommendation also requires confirmation that customers are affected.
We ran three fixture-backed incidents through the dashboard. The payments outage made the boundary easiest to see.
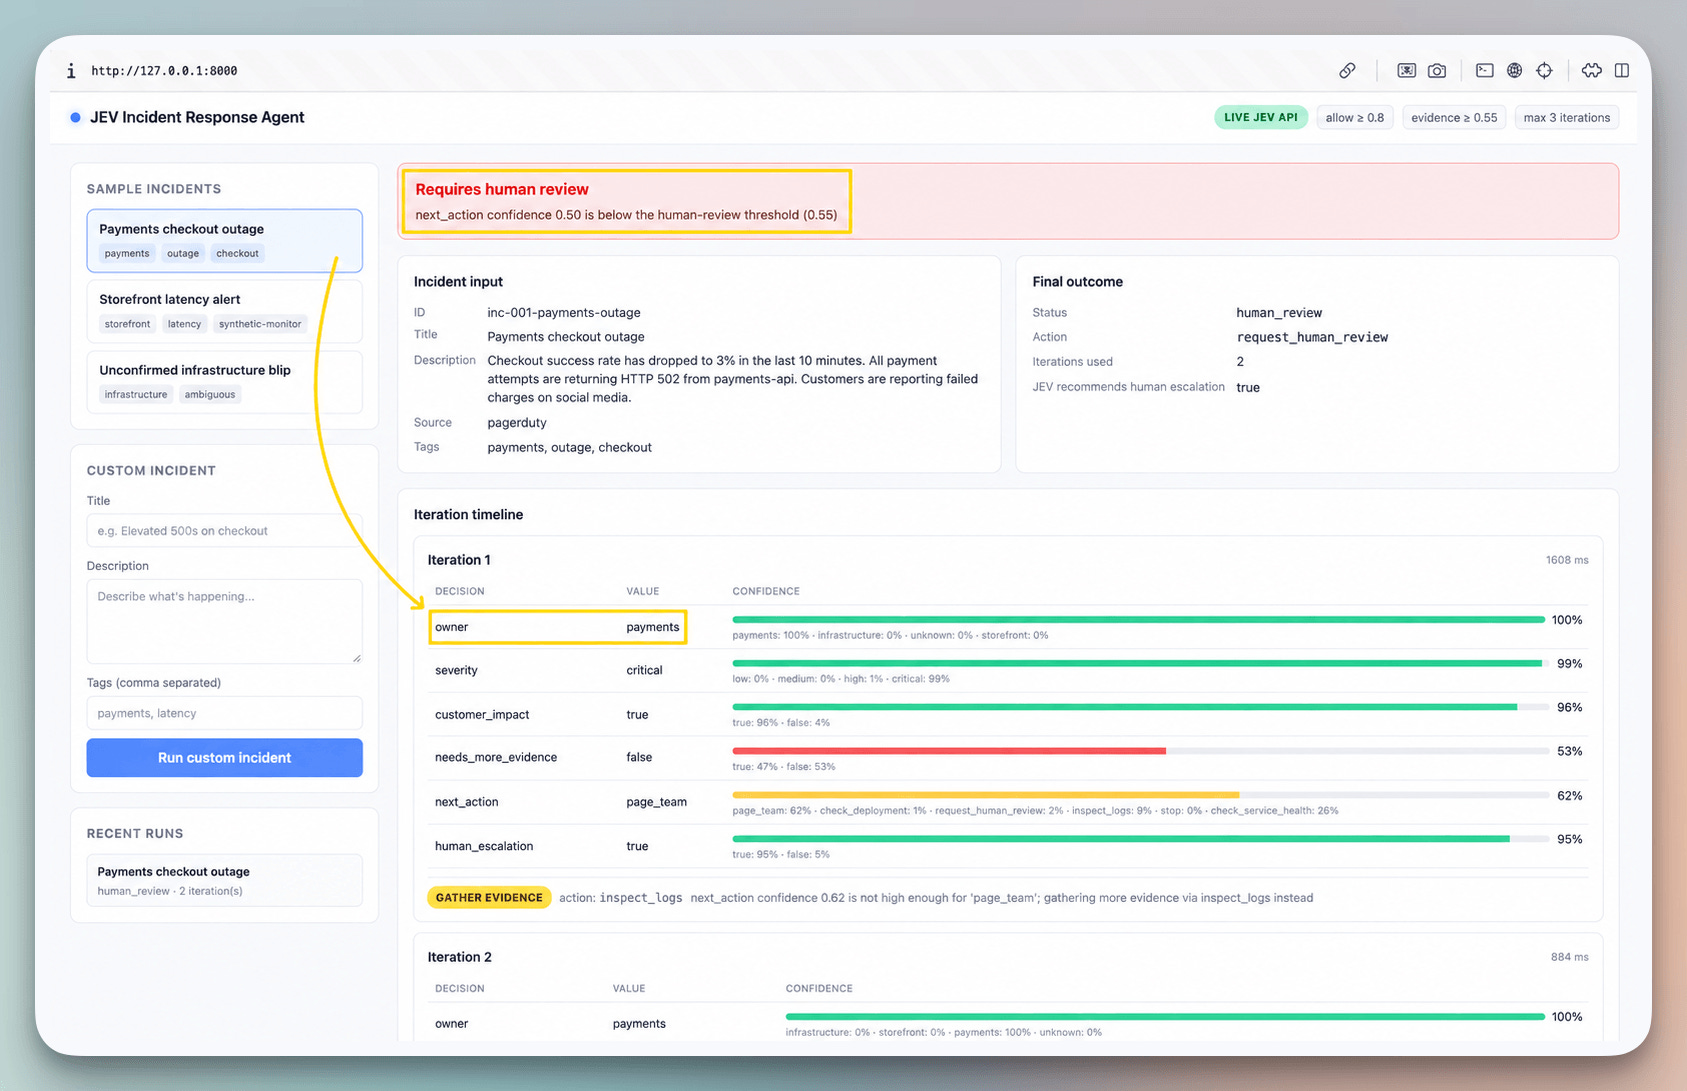
Jev selected page_team with 0.62 confidence, so the policy refused to page and ran inspect_logs instead.
It then evaluated the updated evidence and returned 0.50 confidence, which fell below the human-review threshold. The run stopped without executing another tool.
The dashboard and 46 tests covered what the application did with expected responses. They did not cover whether next_action and its confidence would stay paired in every response the application could receive.
Tracing the decision through the pull request
Reviewing the change meant opening 30 diffs and reading them one by one.
Each diff was understandable on its own.
The problem was that the safety guarantee did not live in any single file. It depended on how the selected action and its probability moved between them.
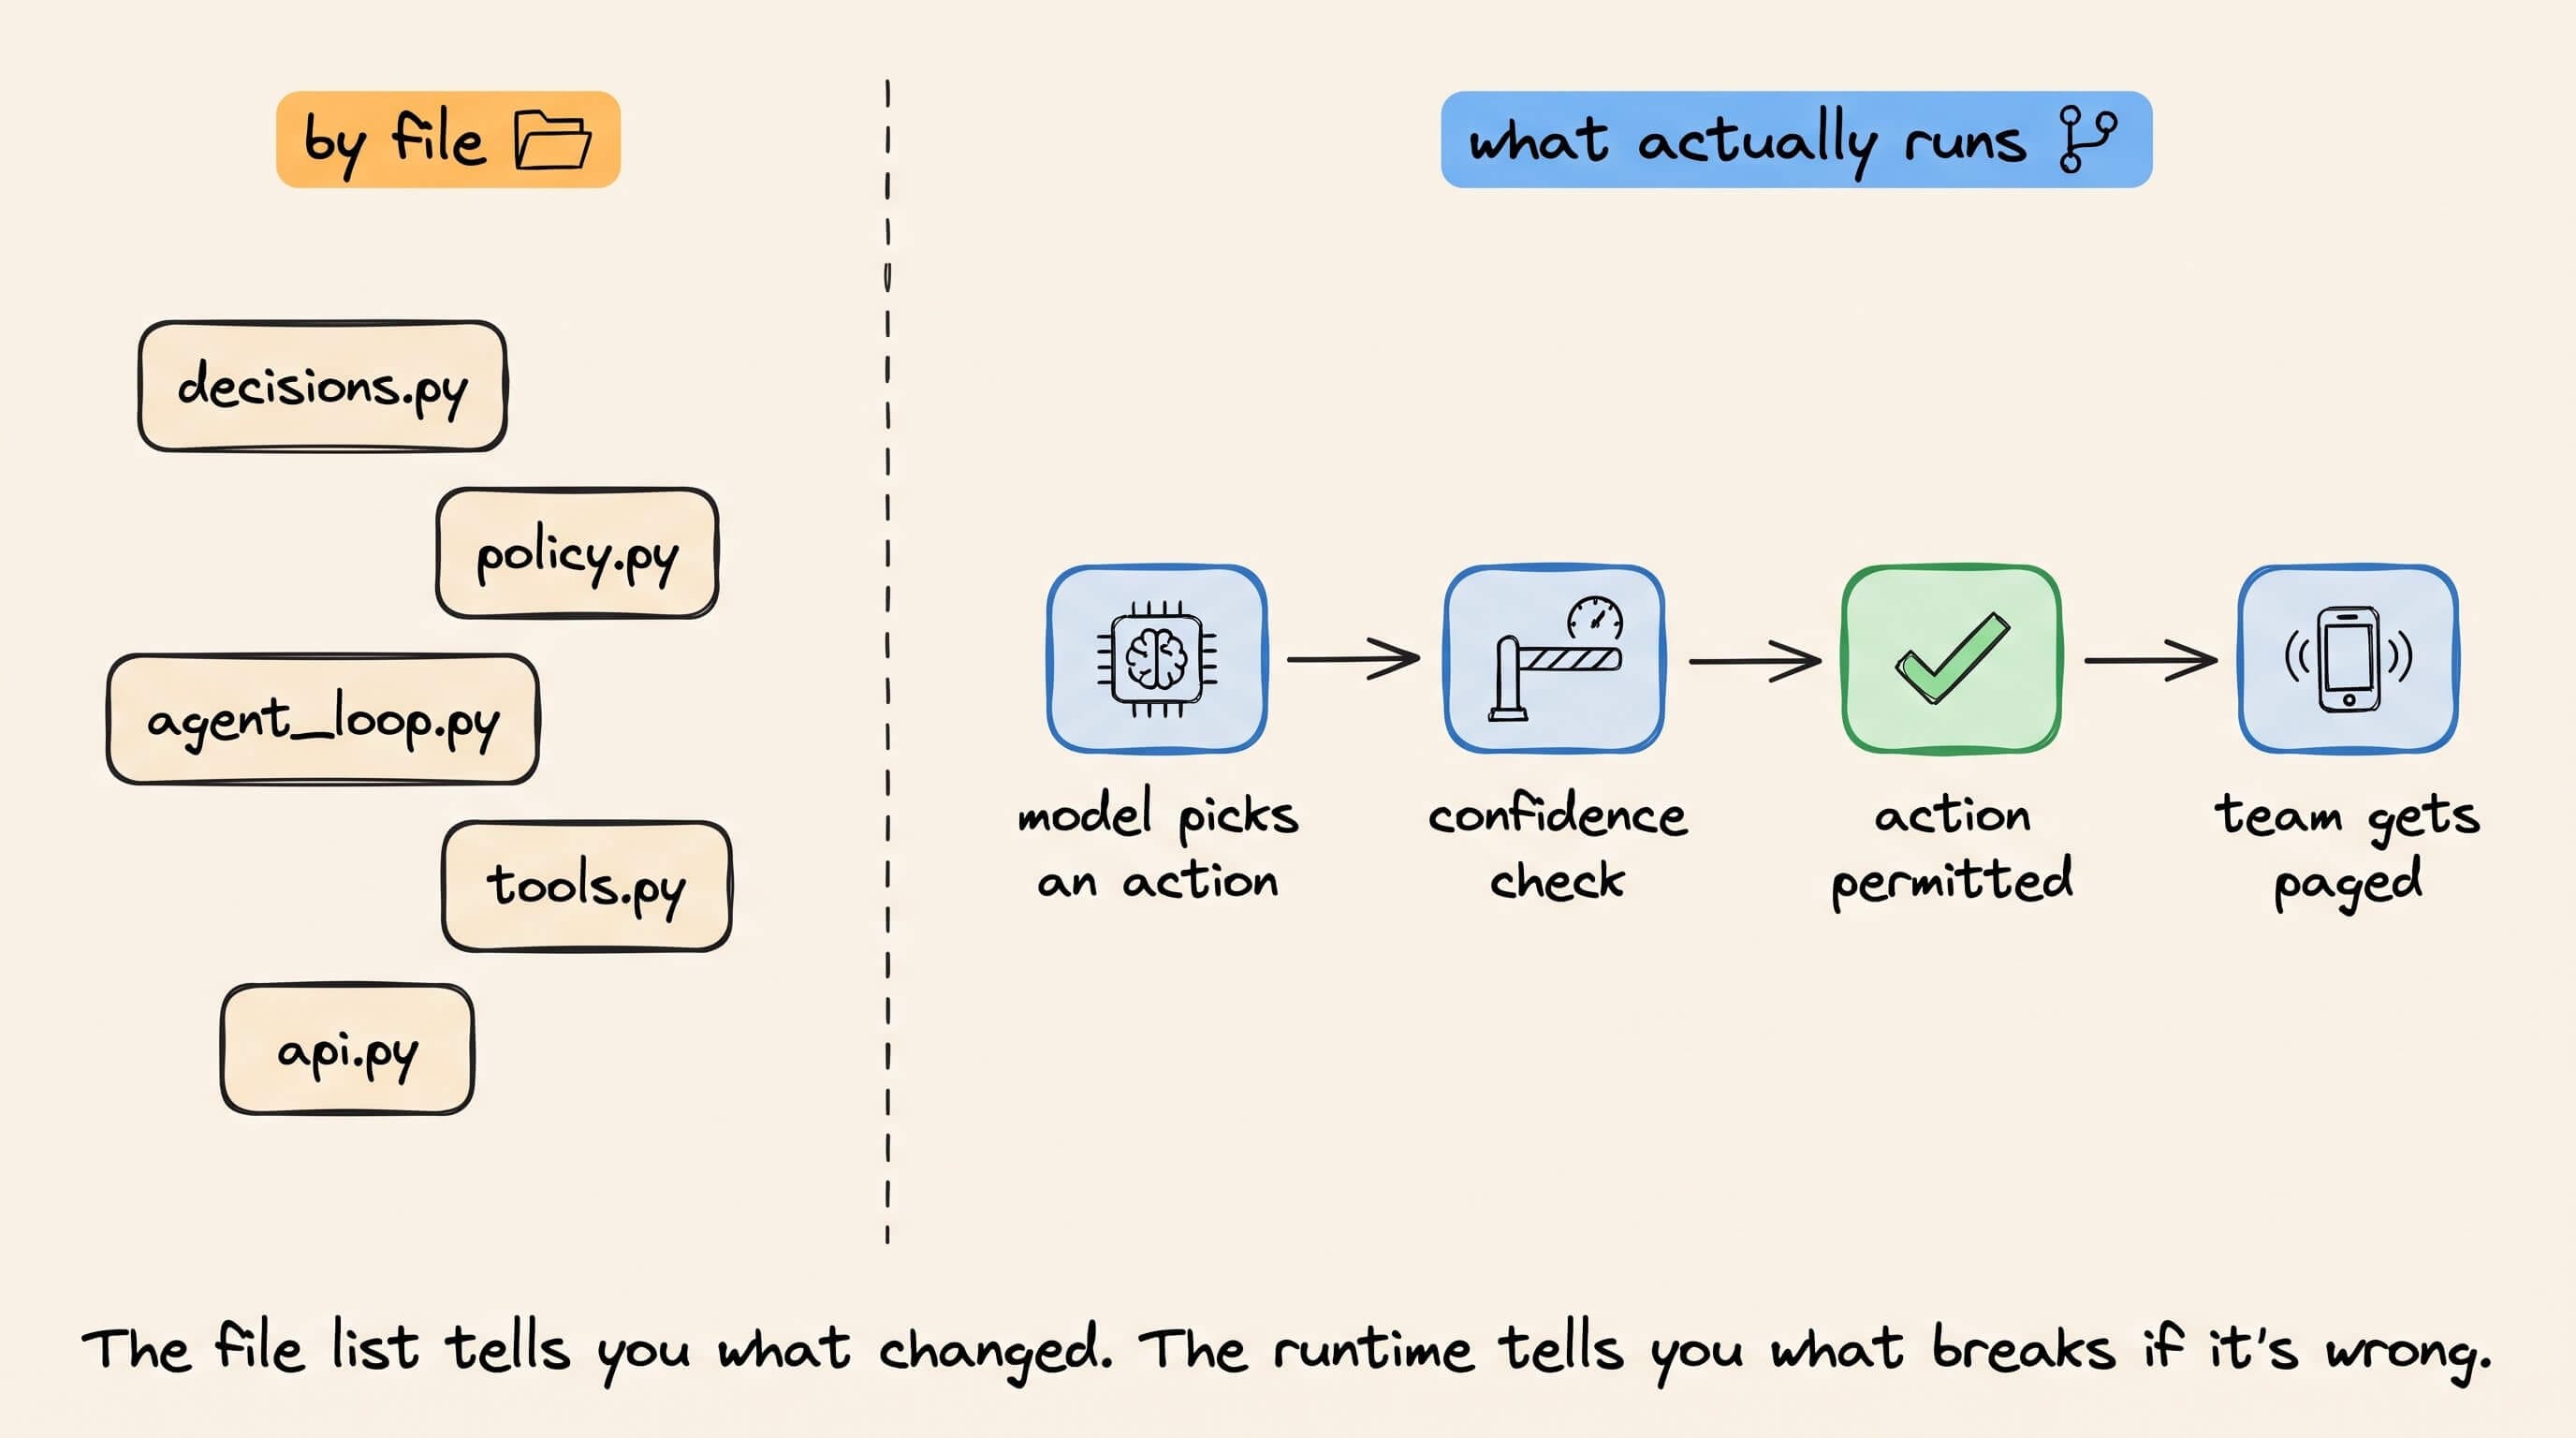
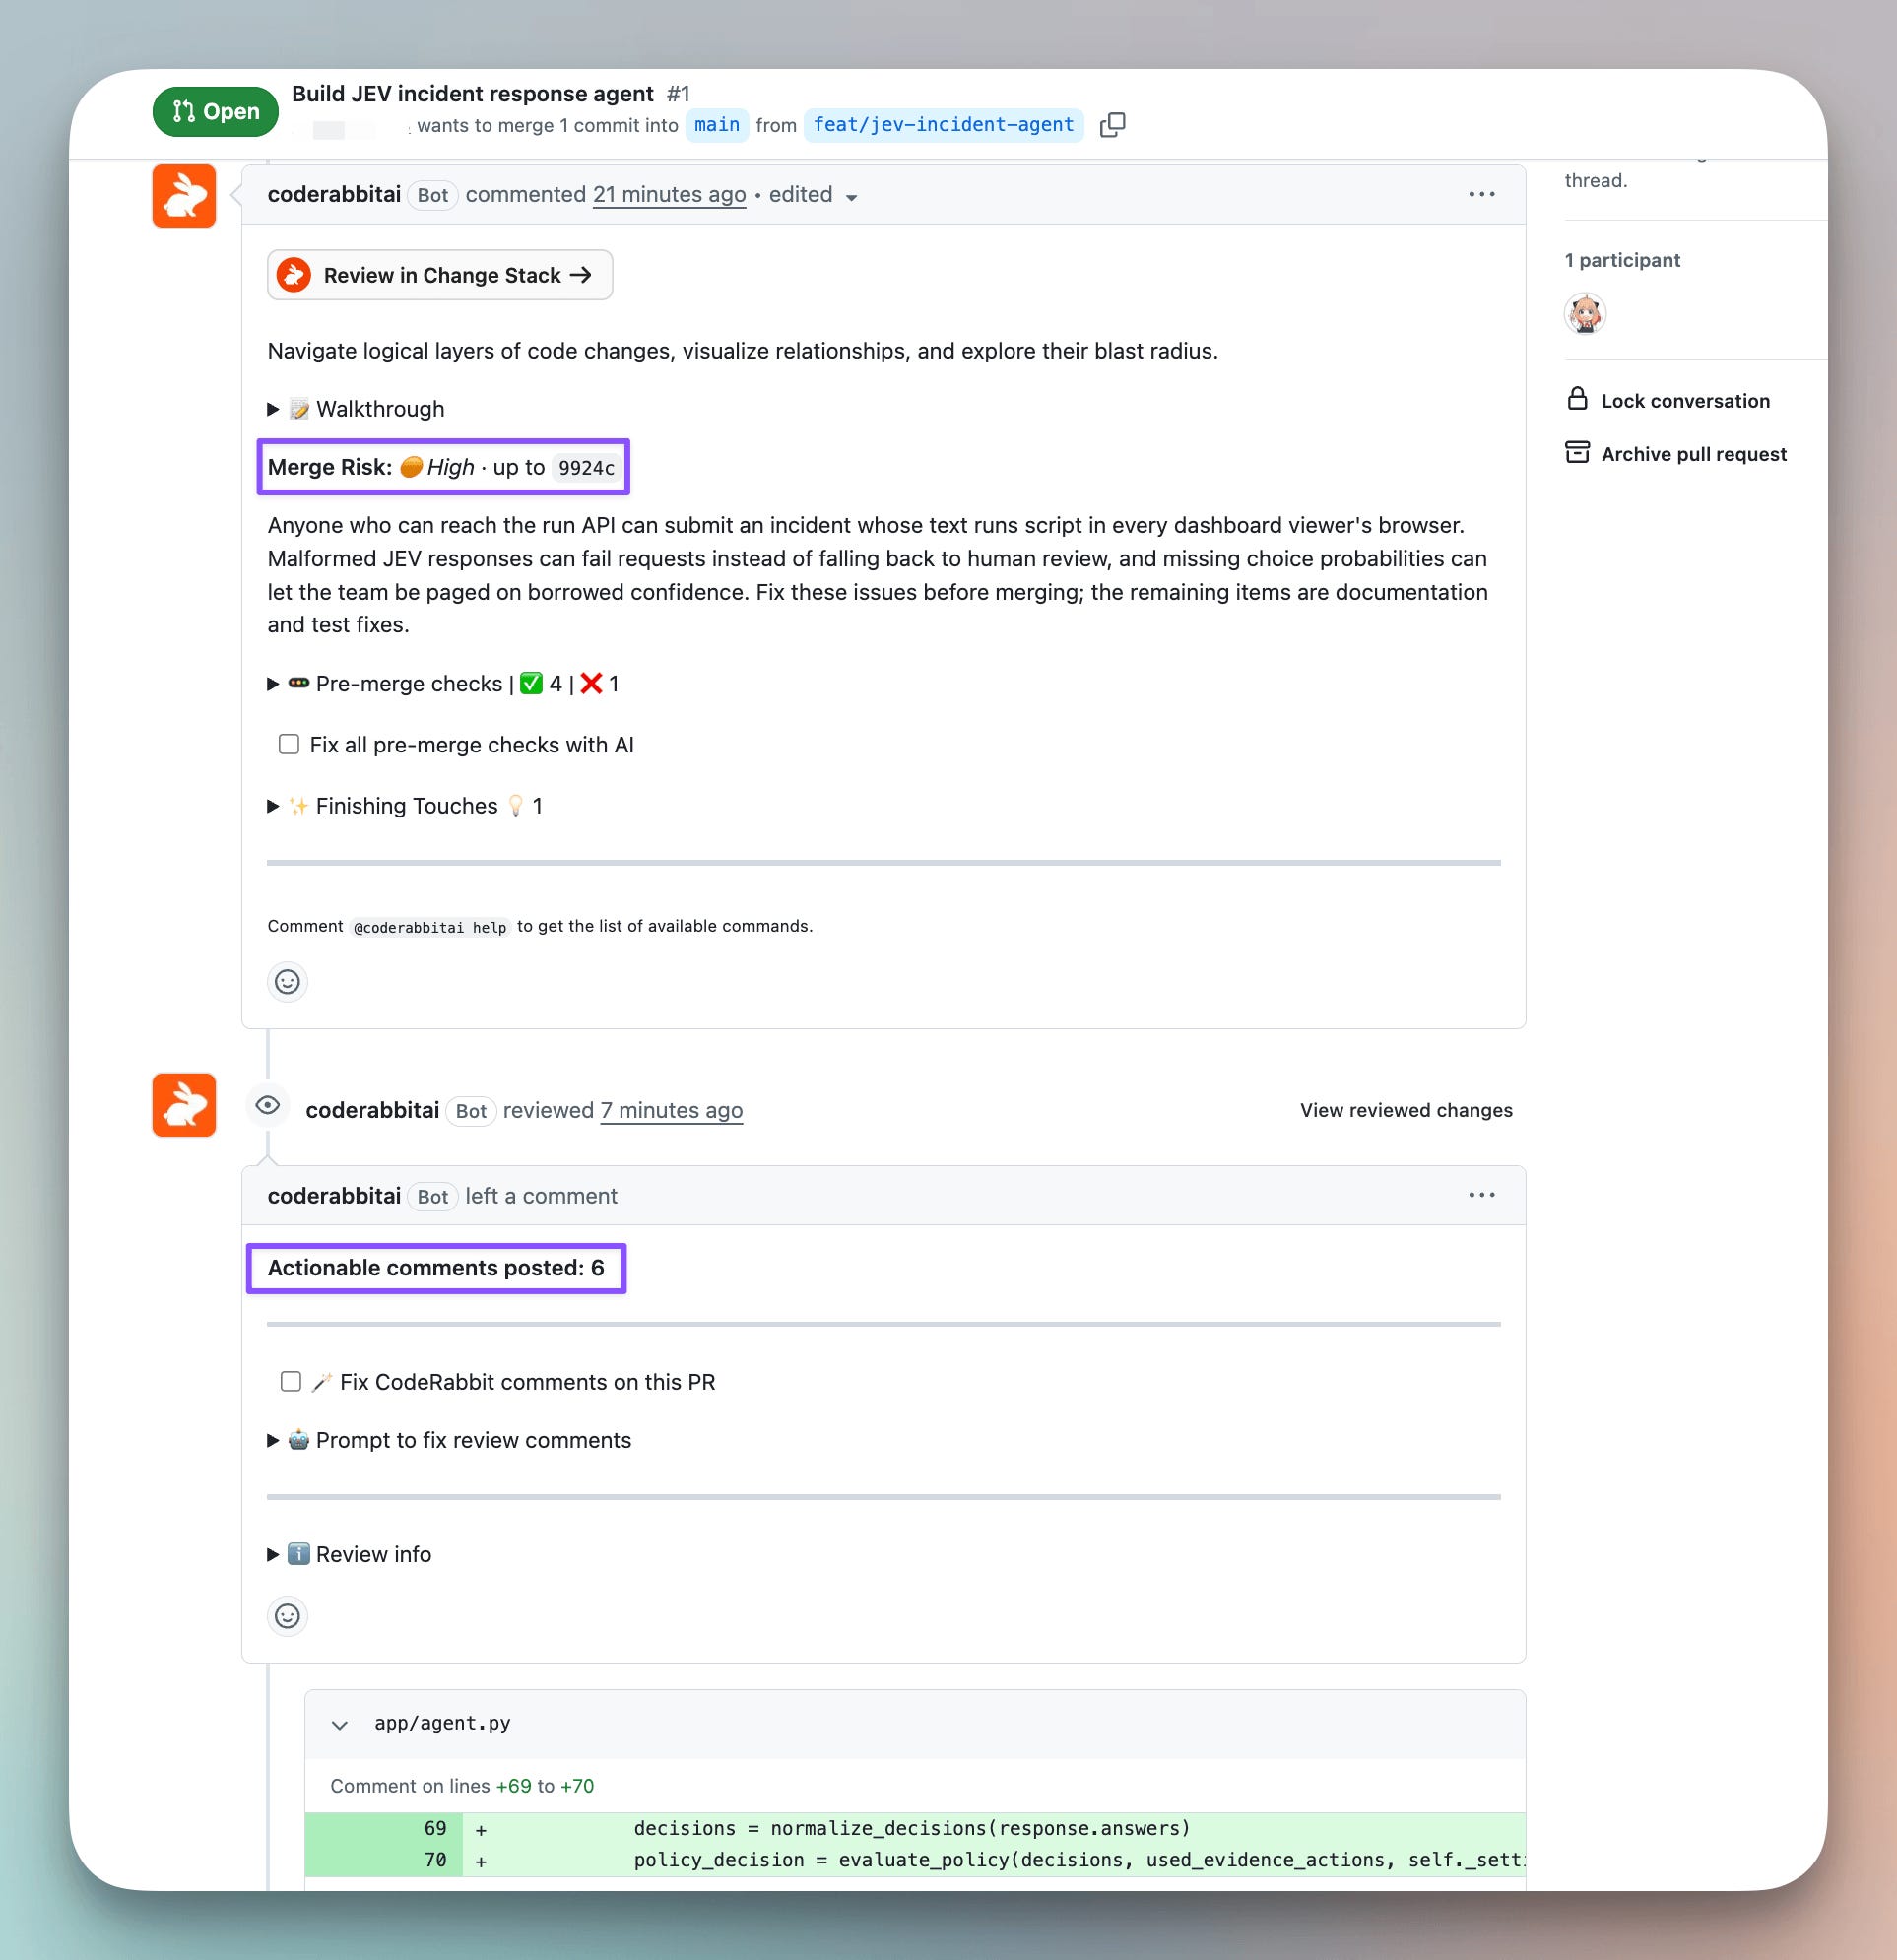
We opened the same PR in CodeRabbit. It reviewed the change automatically, rated the merge risk as High, and posted six actionable comments ranked by severity.
CodeRabbit’s Change Stack grouped the 30 changed files into six logical layers based on their dependencies, giving me a path from the Jev response contract to the resulting tool call.
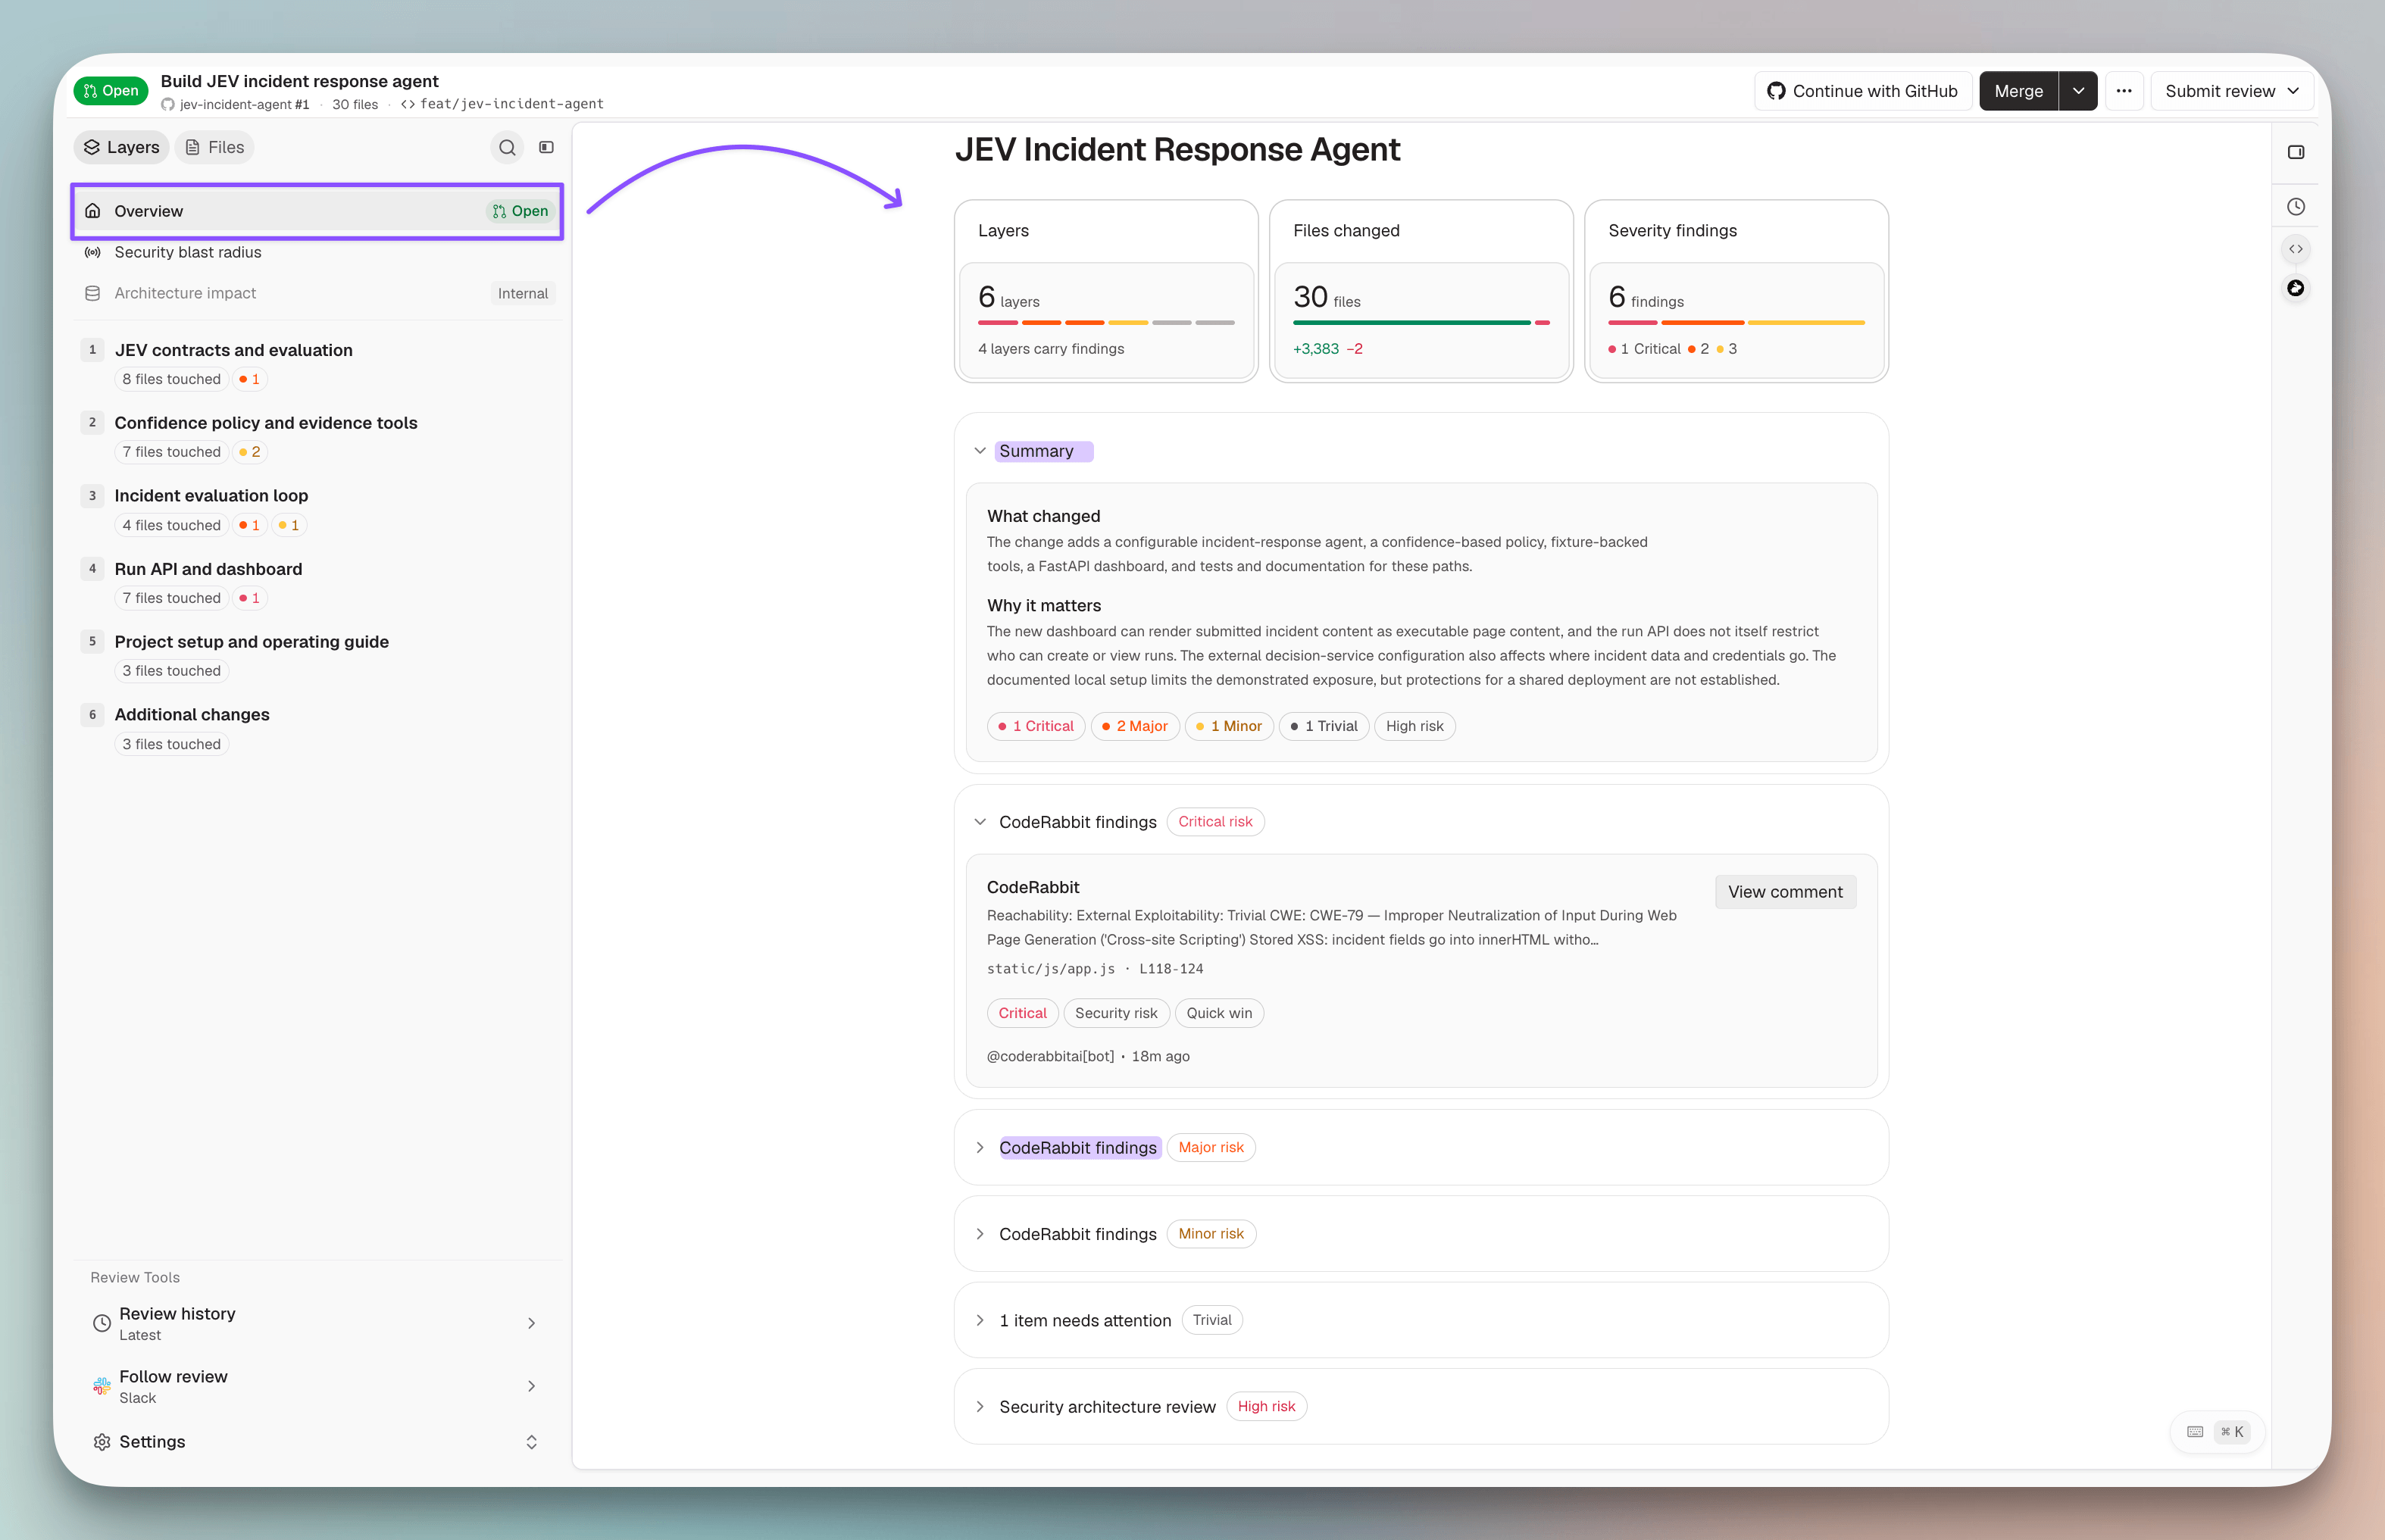
The first four layers covered the code that ran during an incident including the decision, the confidence check, and the loop that chose what to do next.
The remaining two covered the API, the dashboard that exposed the result, and the setup files that supported it.
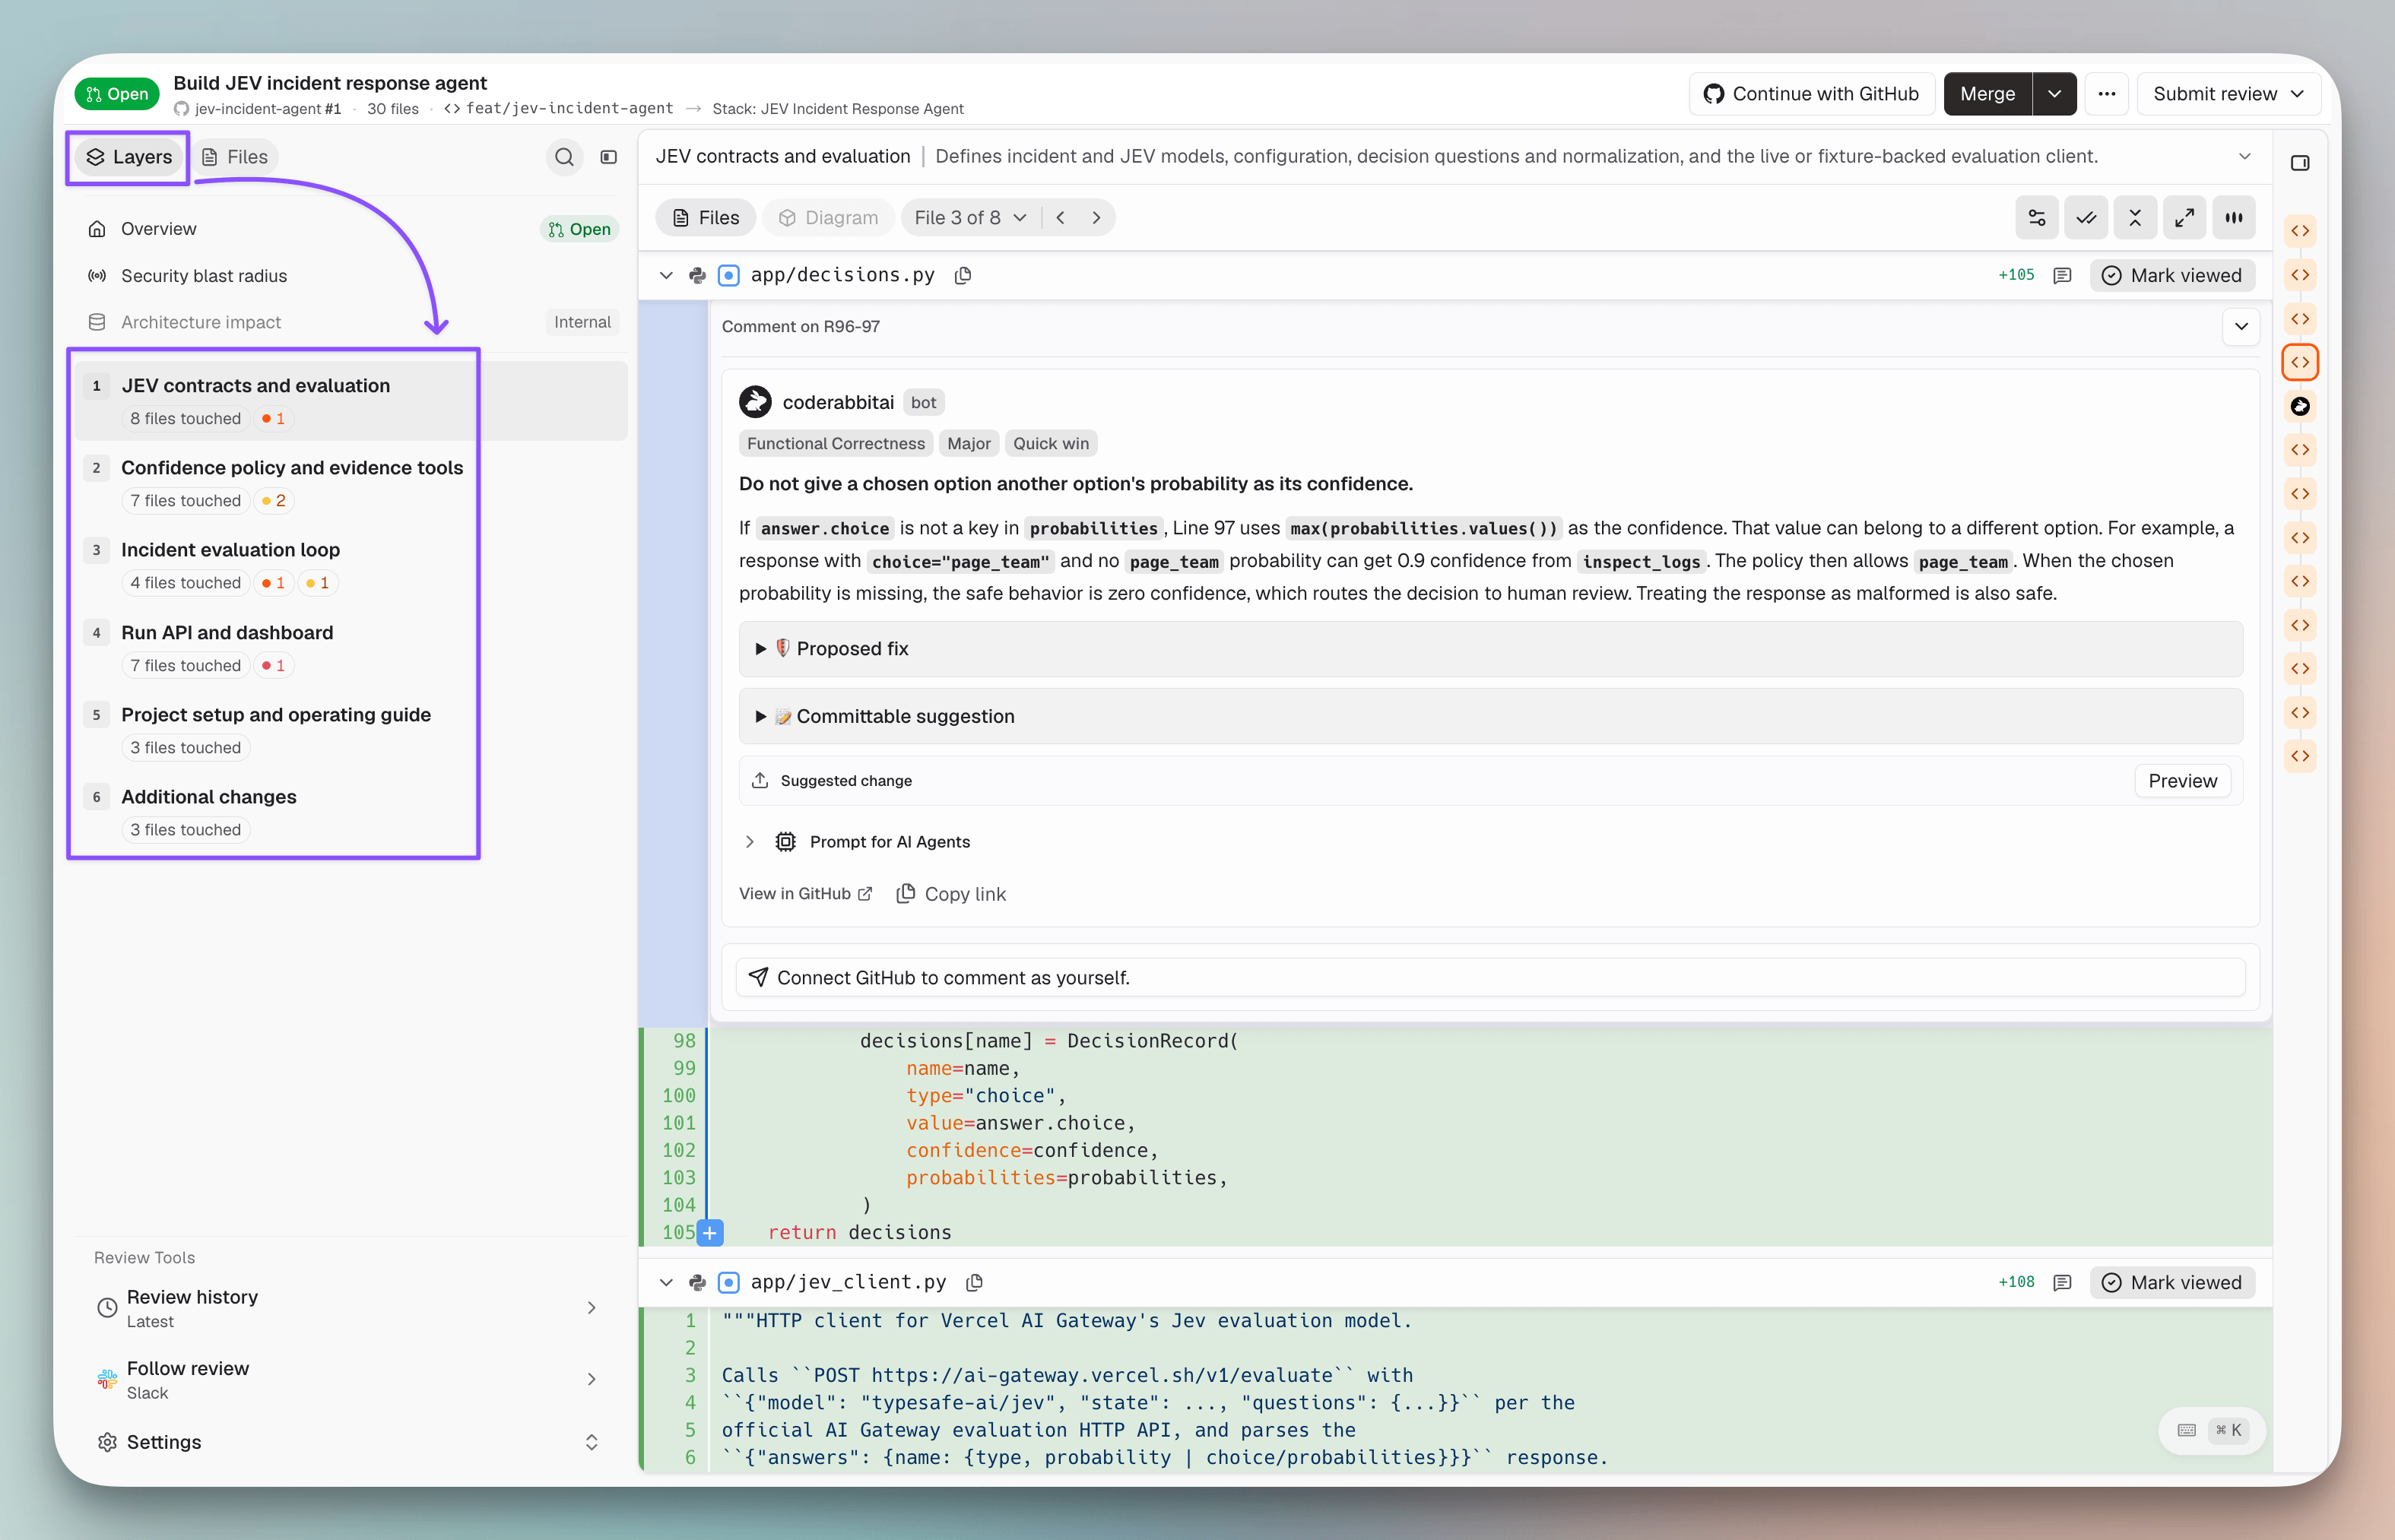
That grouping gave me a reading order that matched the application’s runtime dependencies.
We could start in decisions.py, where the selected action was paired with its probability, then follow the value into the policy and agent loop.
CodeRabbit attached each finding to the relevant layer and ranked them by severity. The first one we opened was in decisions.py, before the confidence value reached the policy.
The confidence bug 46 tests missed
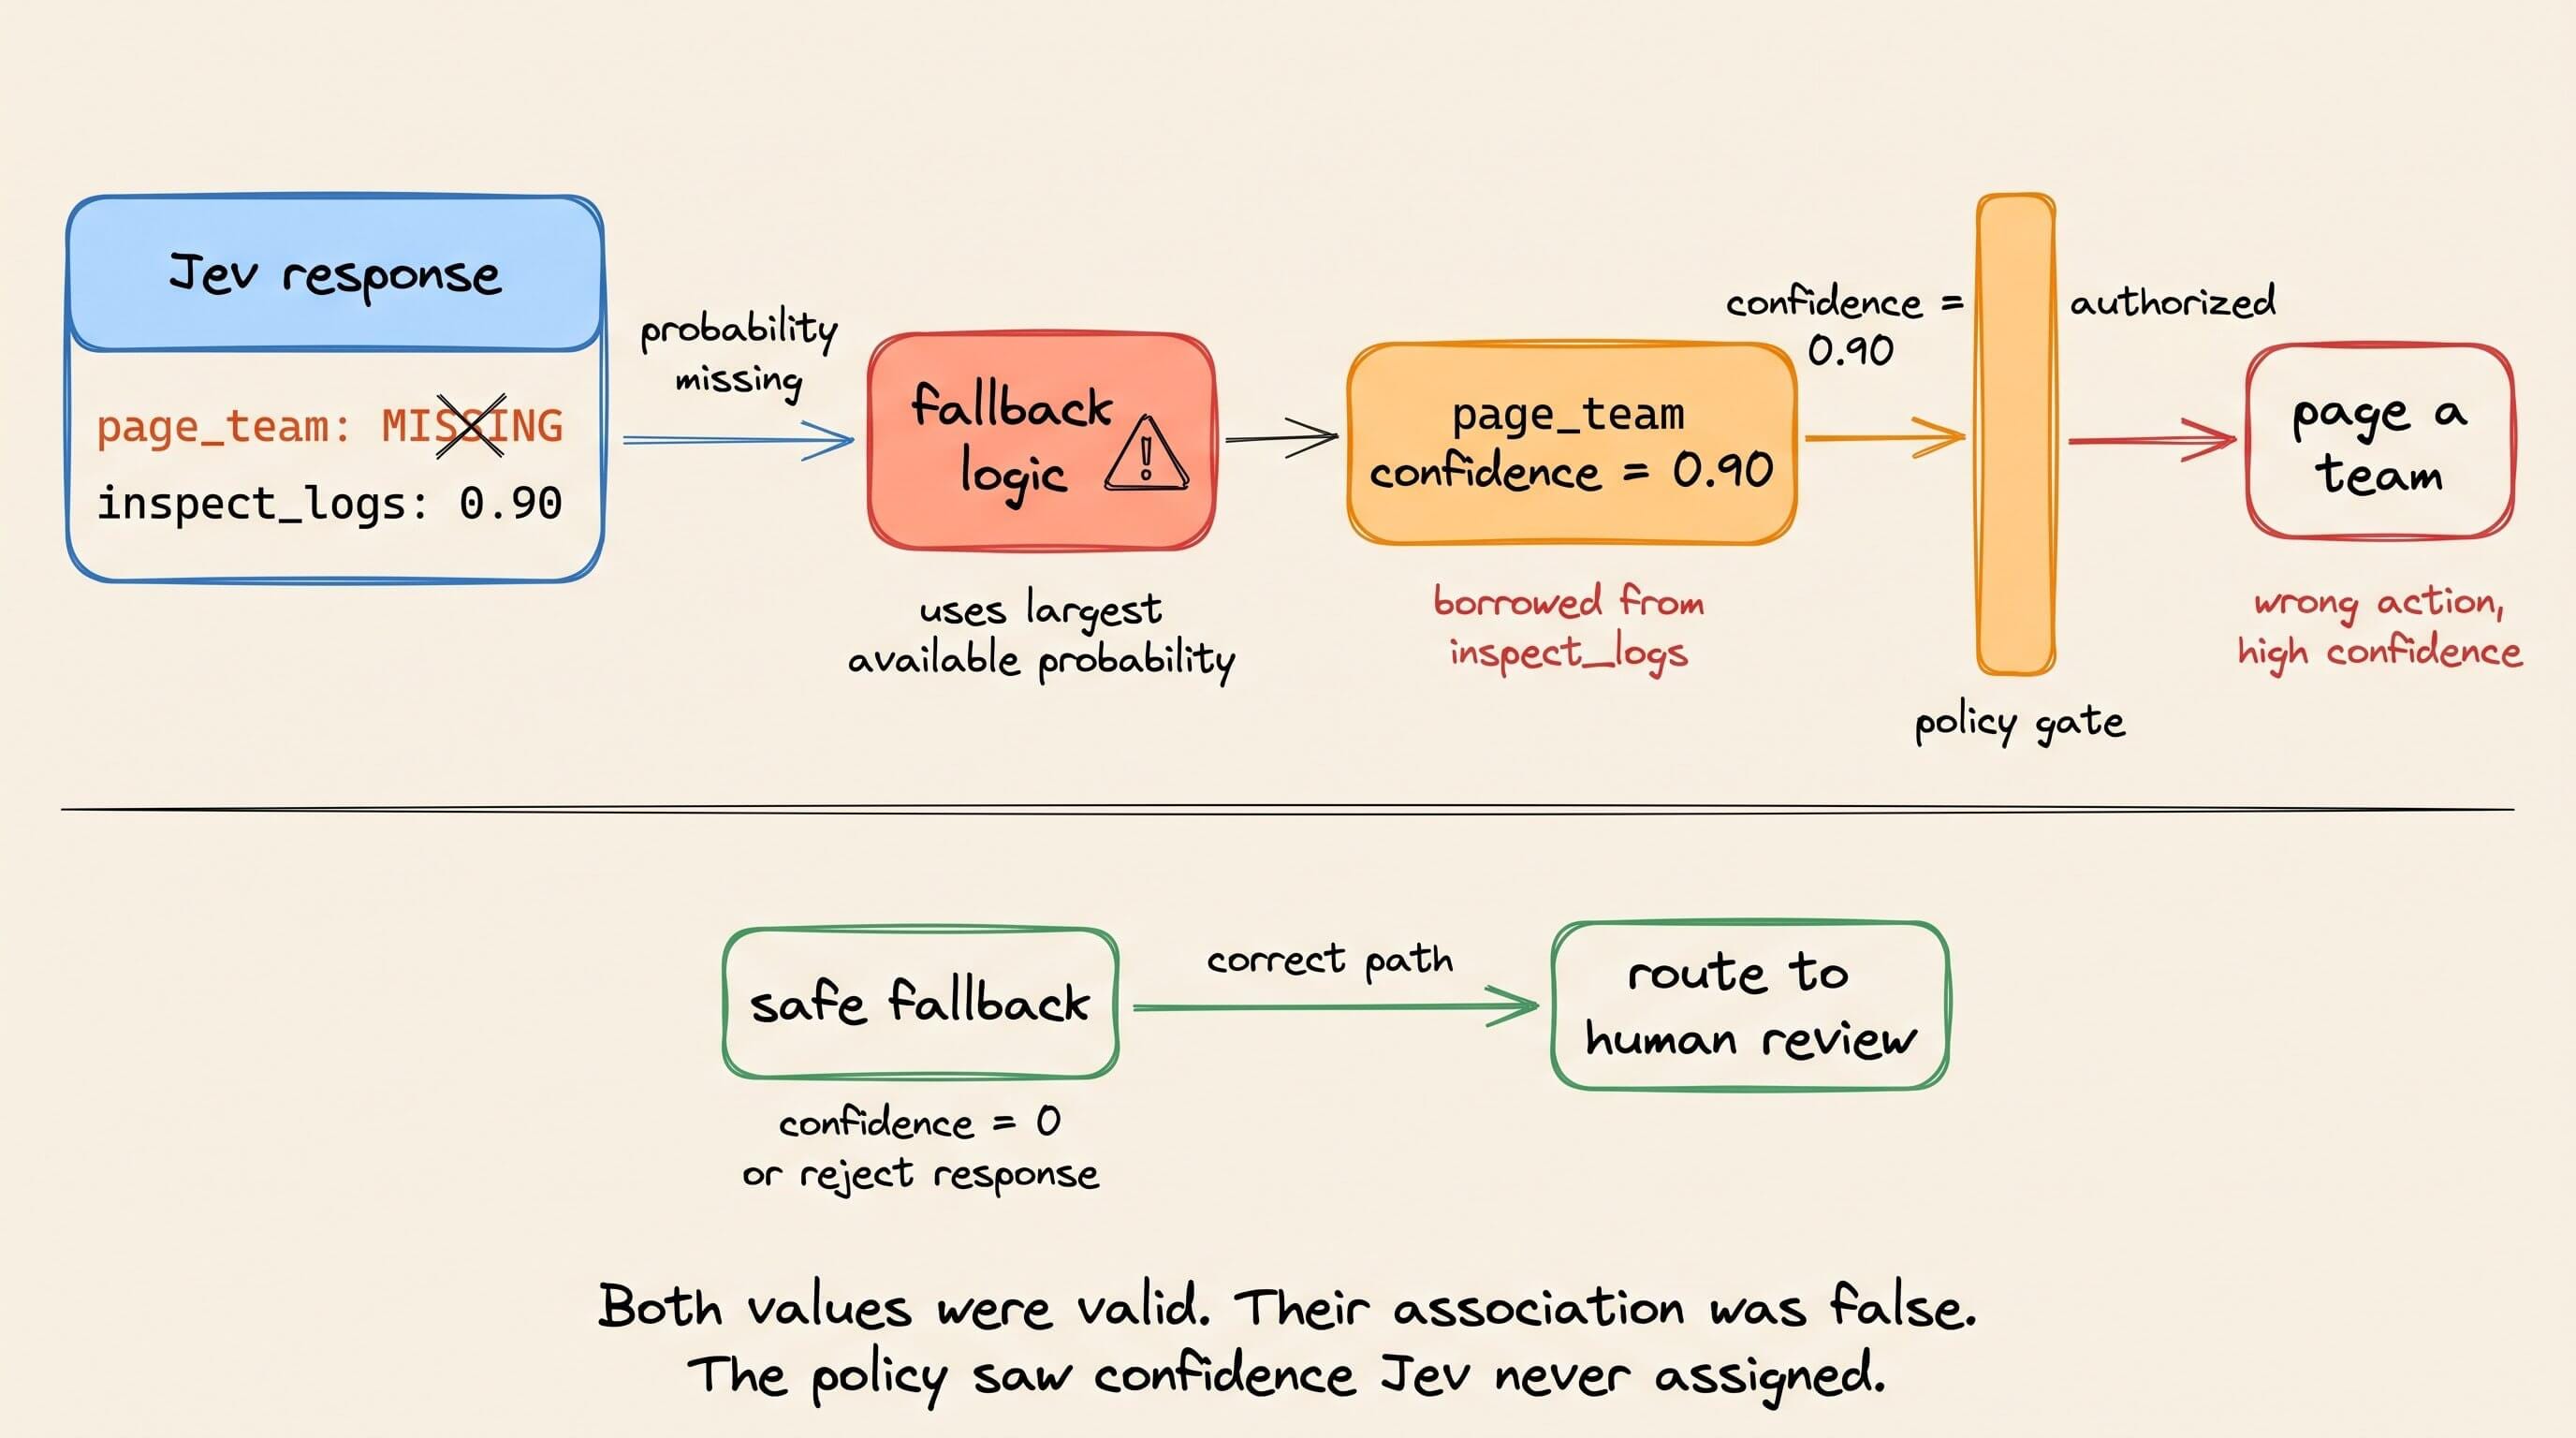
In decisions.py, when the selected choice was absent from the returned probability map, the code used the largest probability from any option as the selected choice's confidence.
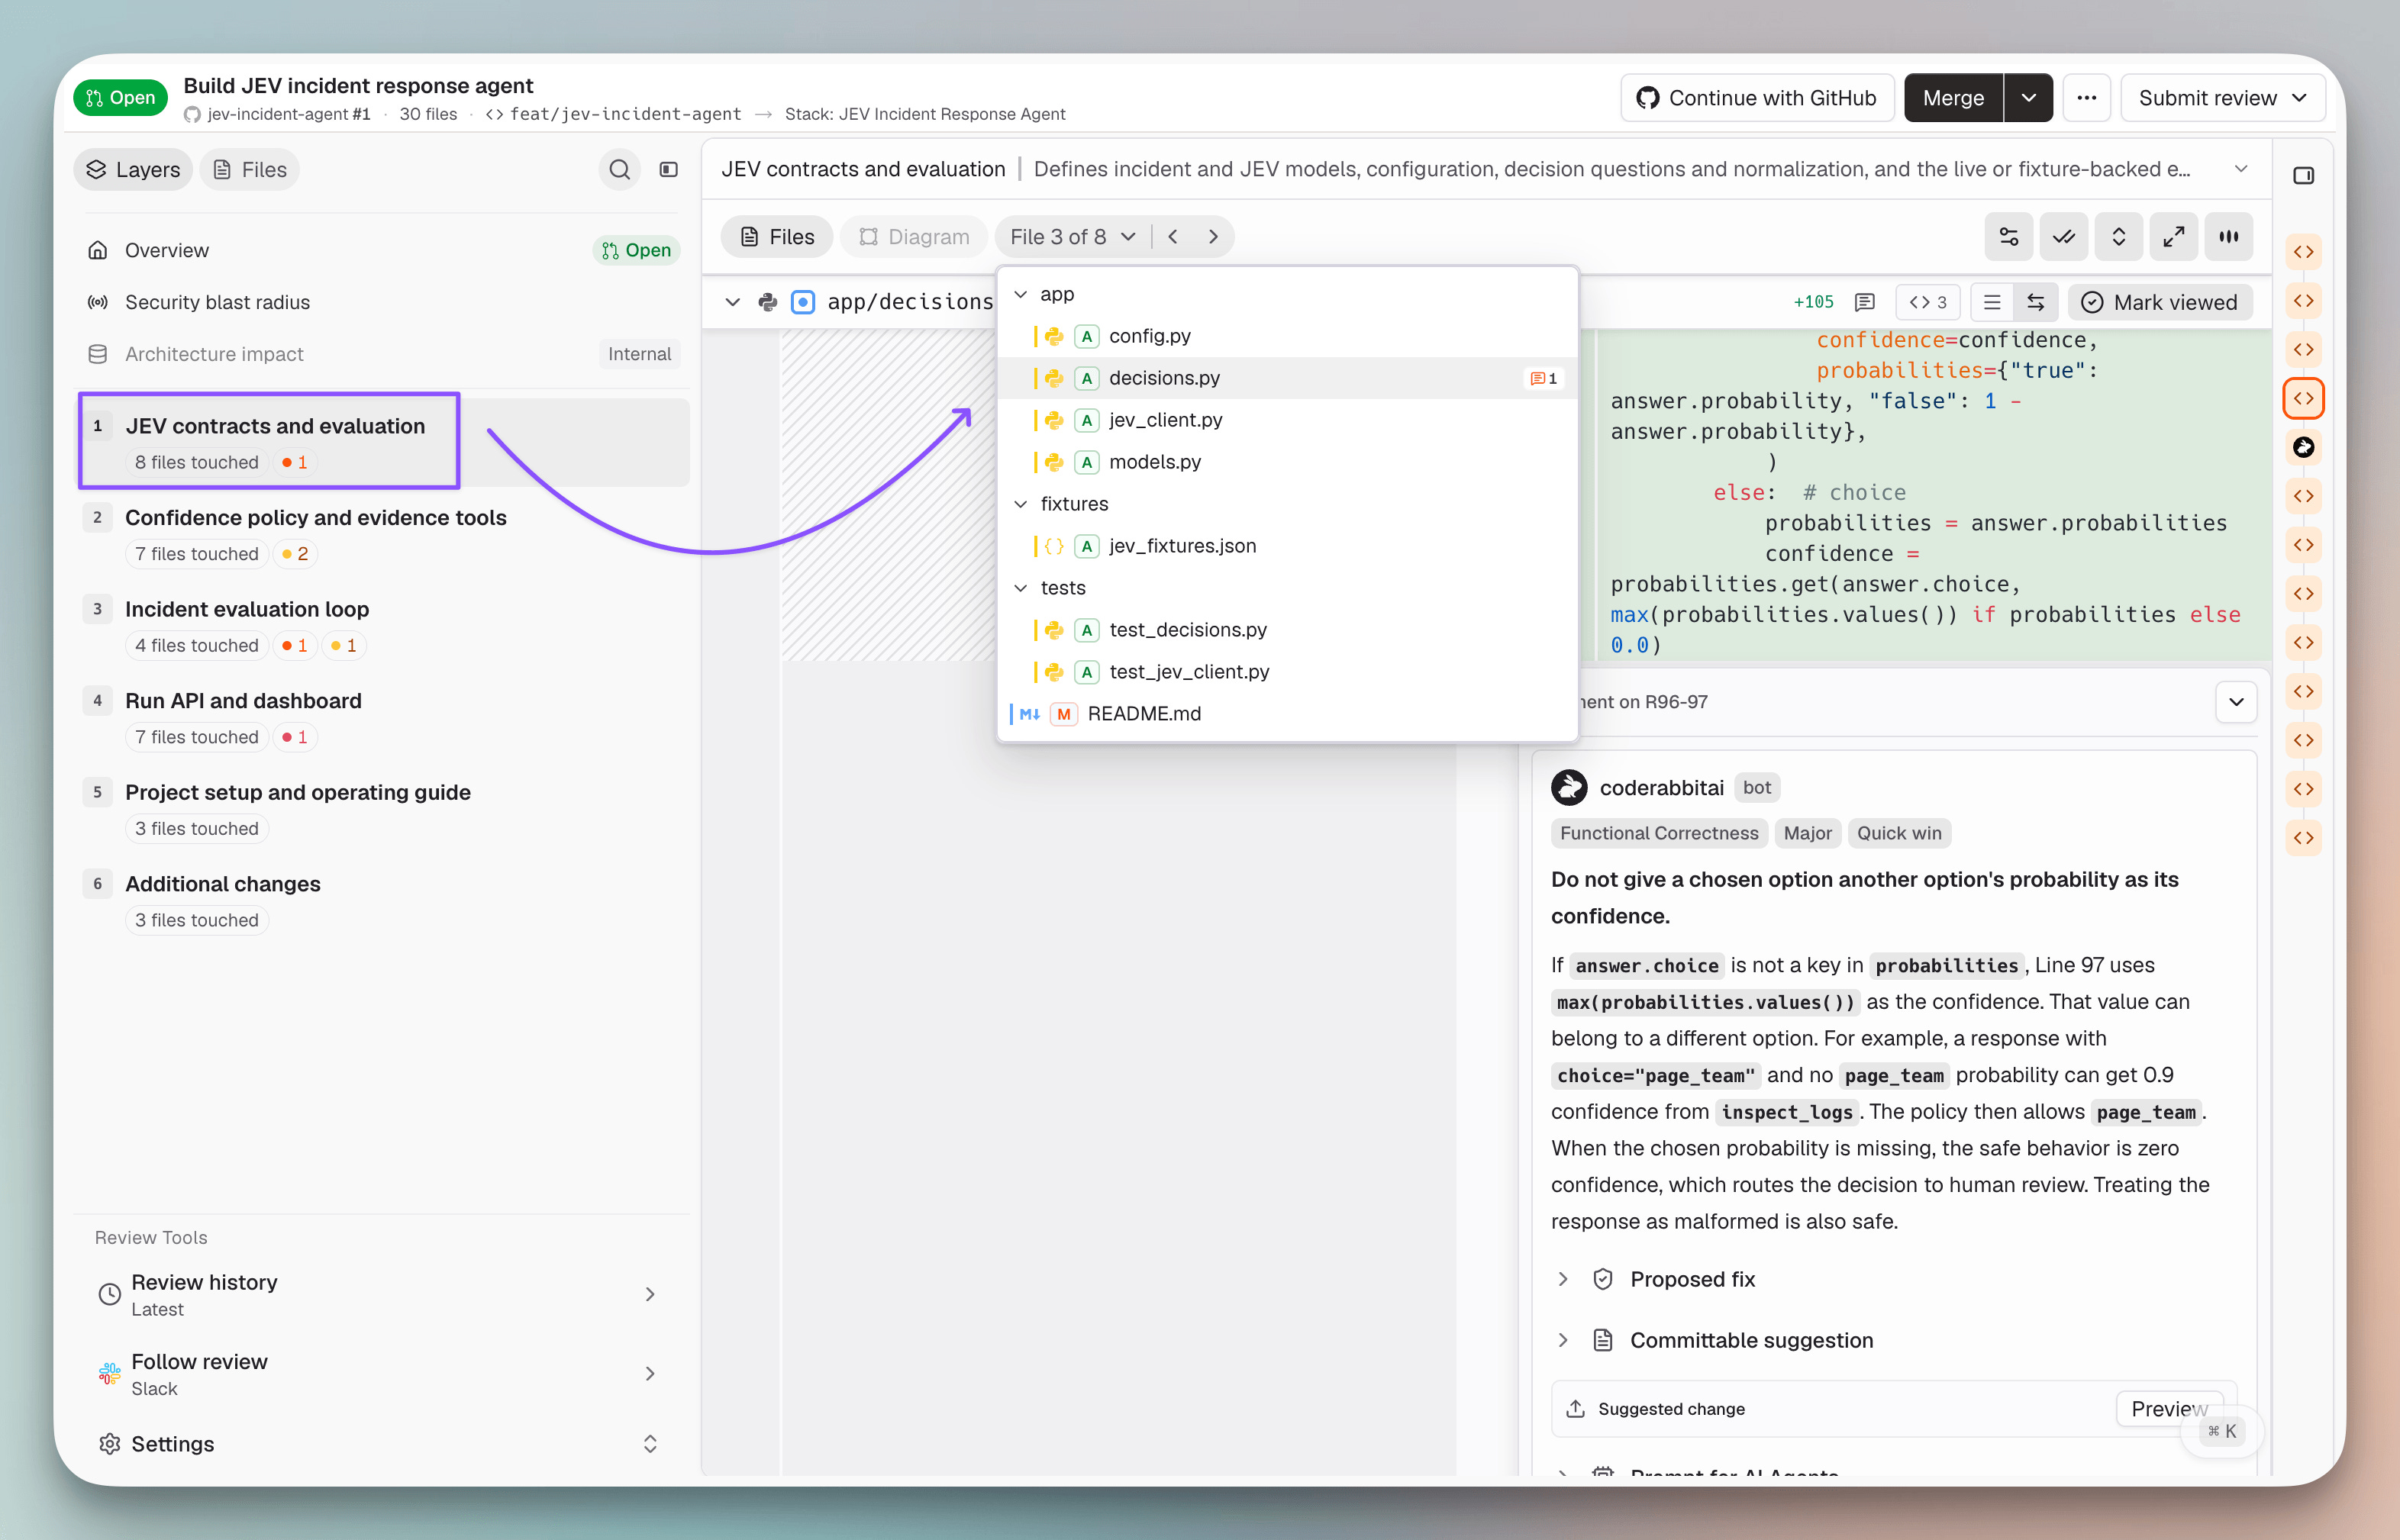
That fallback can combine two valid values into an invalid decision.
choice = page_team
page_team probability = missing
inspect_logs probability = 0.90

normalized confidence for page_team = 0.90
Both values are valid on their own, but their association is false. The policy now sees a high-confidence paging decision even though Jev never assigned page_team that score.
The dashboard did not expose the failure because its live responses always included the selected option’s probability. The tests missed it for the same reason.
Every fixture preserved the expected relationship between choice and probabilities.
The safe behavior is to assign zero confidence or reject the response and route the run to human review. CodeRabbit flagged the untested response and explained how the fallback could authorize a tool call.
Tracing security from the API to the dashboard
The confidence bug was one of six findings. The others tracked where external input entered the system and what it could reach from there.
Change Stack’s security blast-radius view mapped four findings across five changed components.
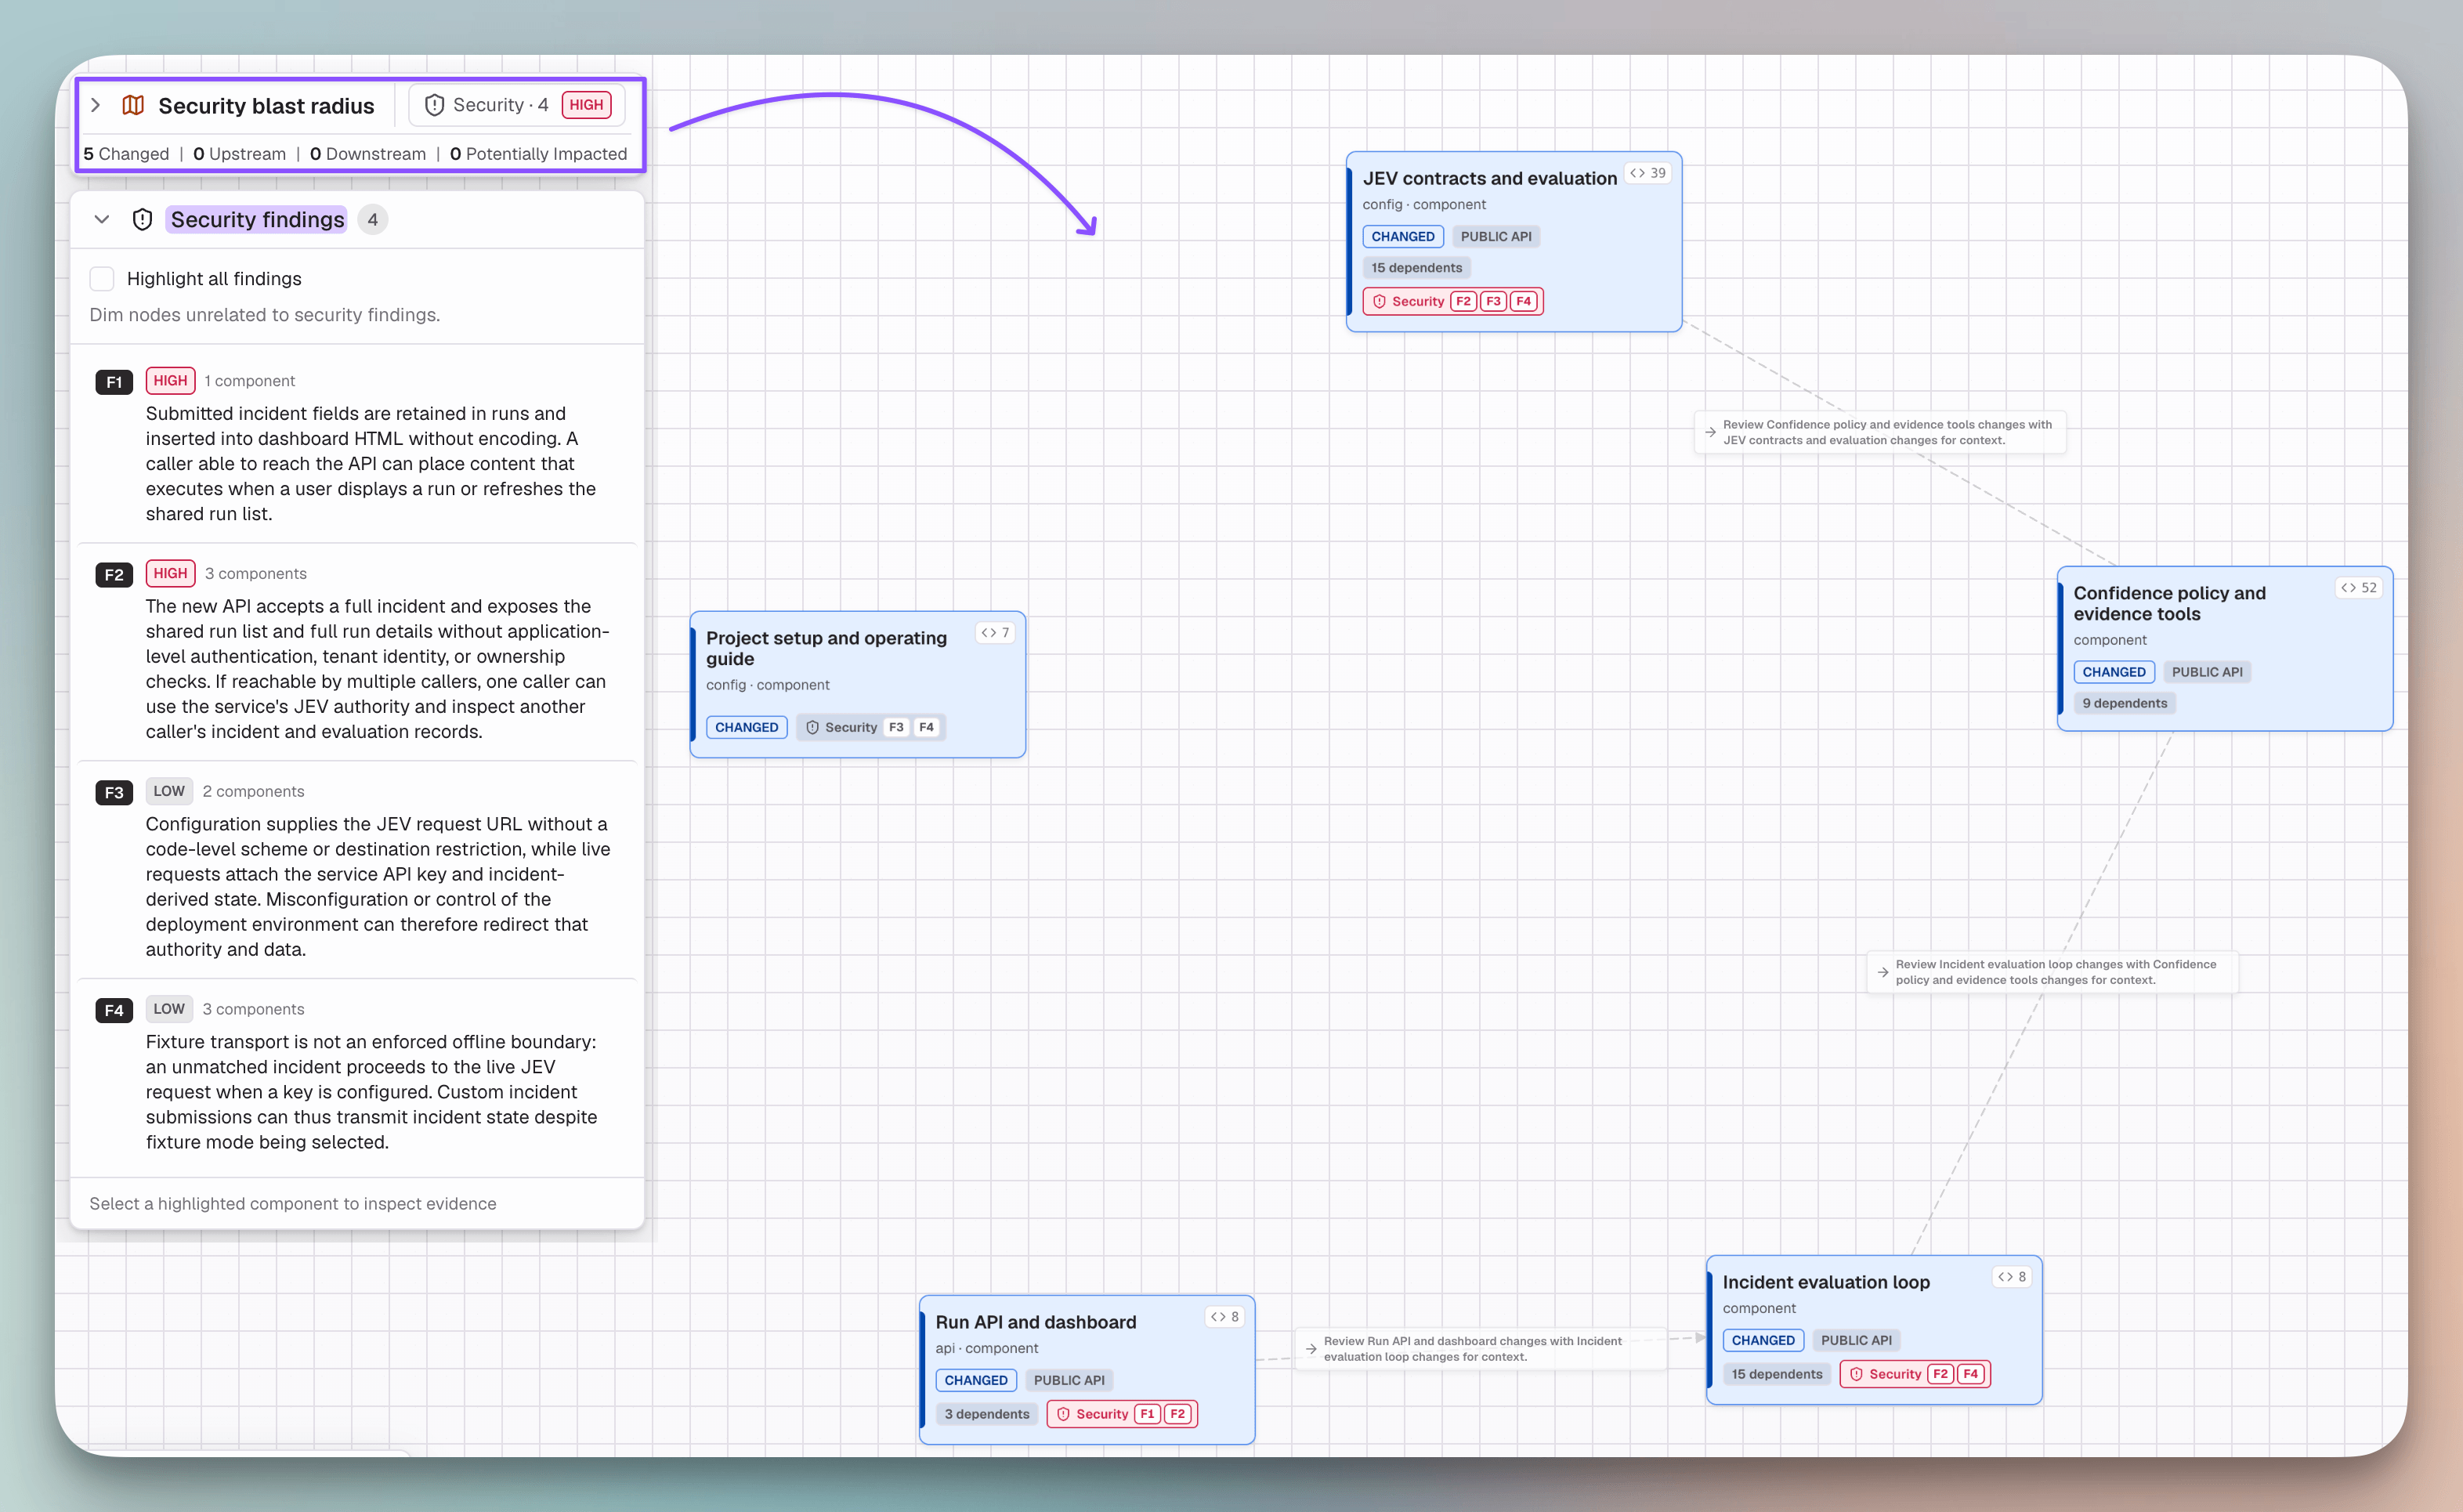
The highest-impact path began with incident text submitted through the Run API. The application retained that text in a shared run state.
The dashboard later inserted it into HTML without encoding, creating a stored XSS vulnerability. Anyone able to reach the API could store content that executed when another user viewed the run.
Three other boundaries had their own exposure:
The API exposed shared incidents and evaluation records without authorization or ownership checks.
The Jev request URL could be changed without restricting its scheme or destination.
Fixture mode could fall through to a live request when an incident did not match a fixture.
The vulnerable line was in the dashboard, but the exploit path began at the API and crossed the shared state. The blast-radius view connected those components instead of treating the rendering line as an isolated defect.
Validating the agent-generated change
Generating code doesn't make a change ready to merge. Agentic Change Management helps teams understand how the change fits the architecture, identify its riskiest paths, and validate behavior and security across the full change.
That control continues after merge, helping keep the codebase secure and maintainable.
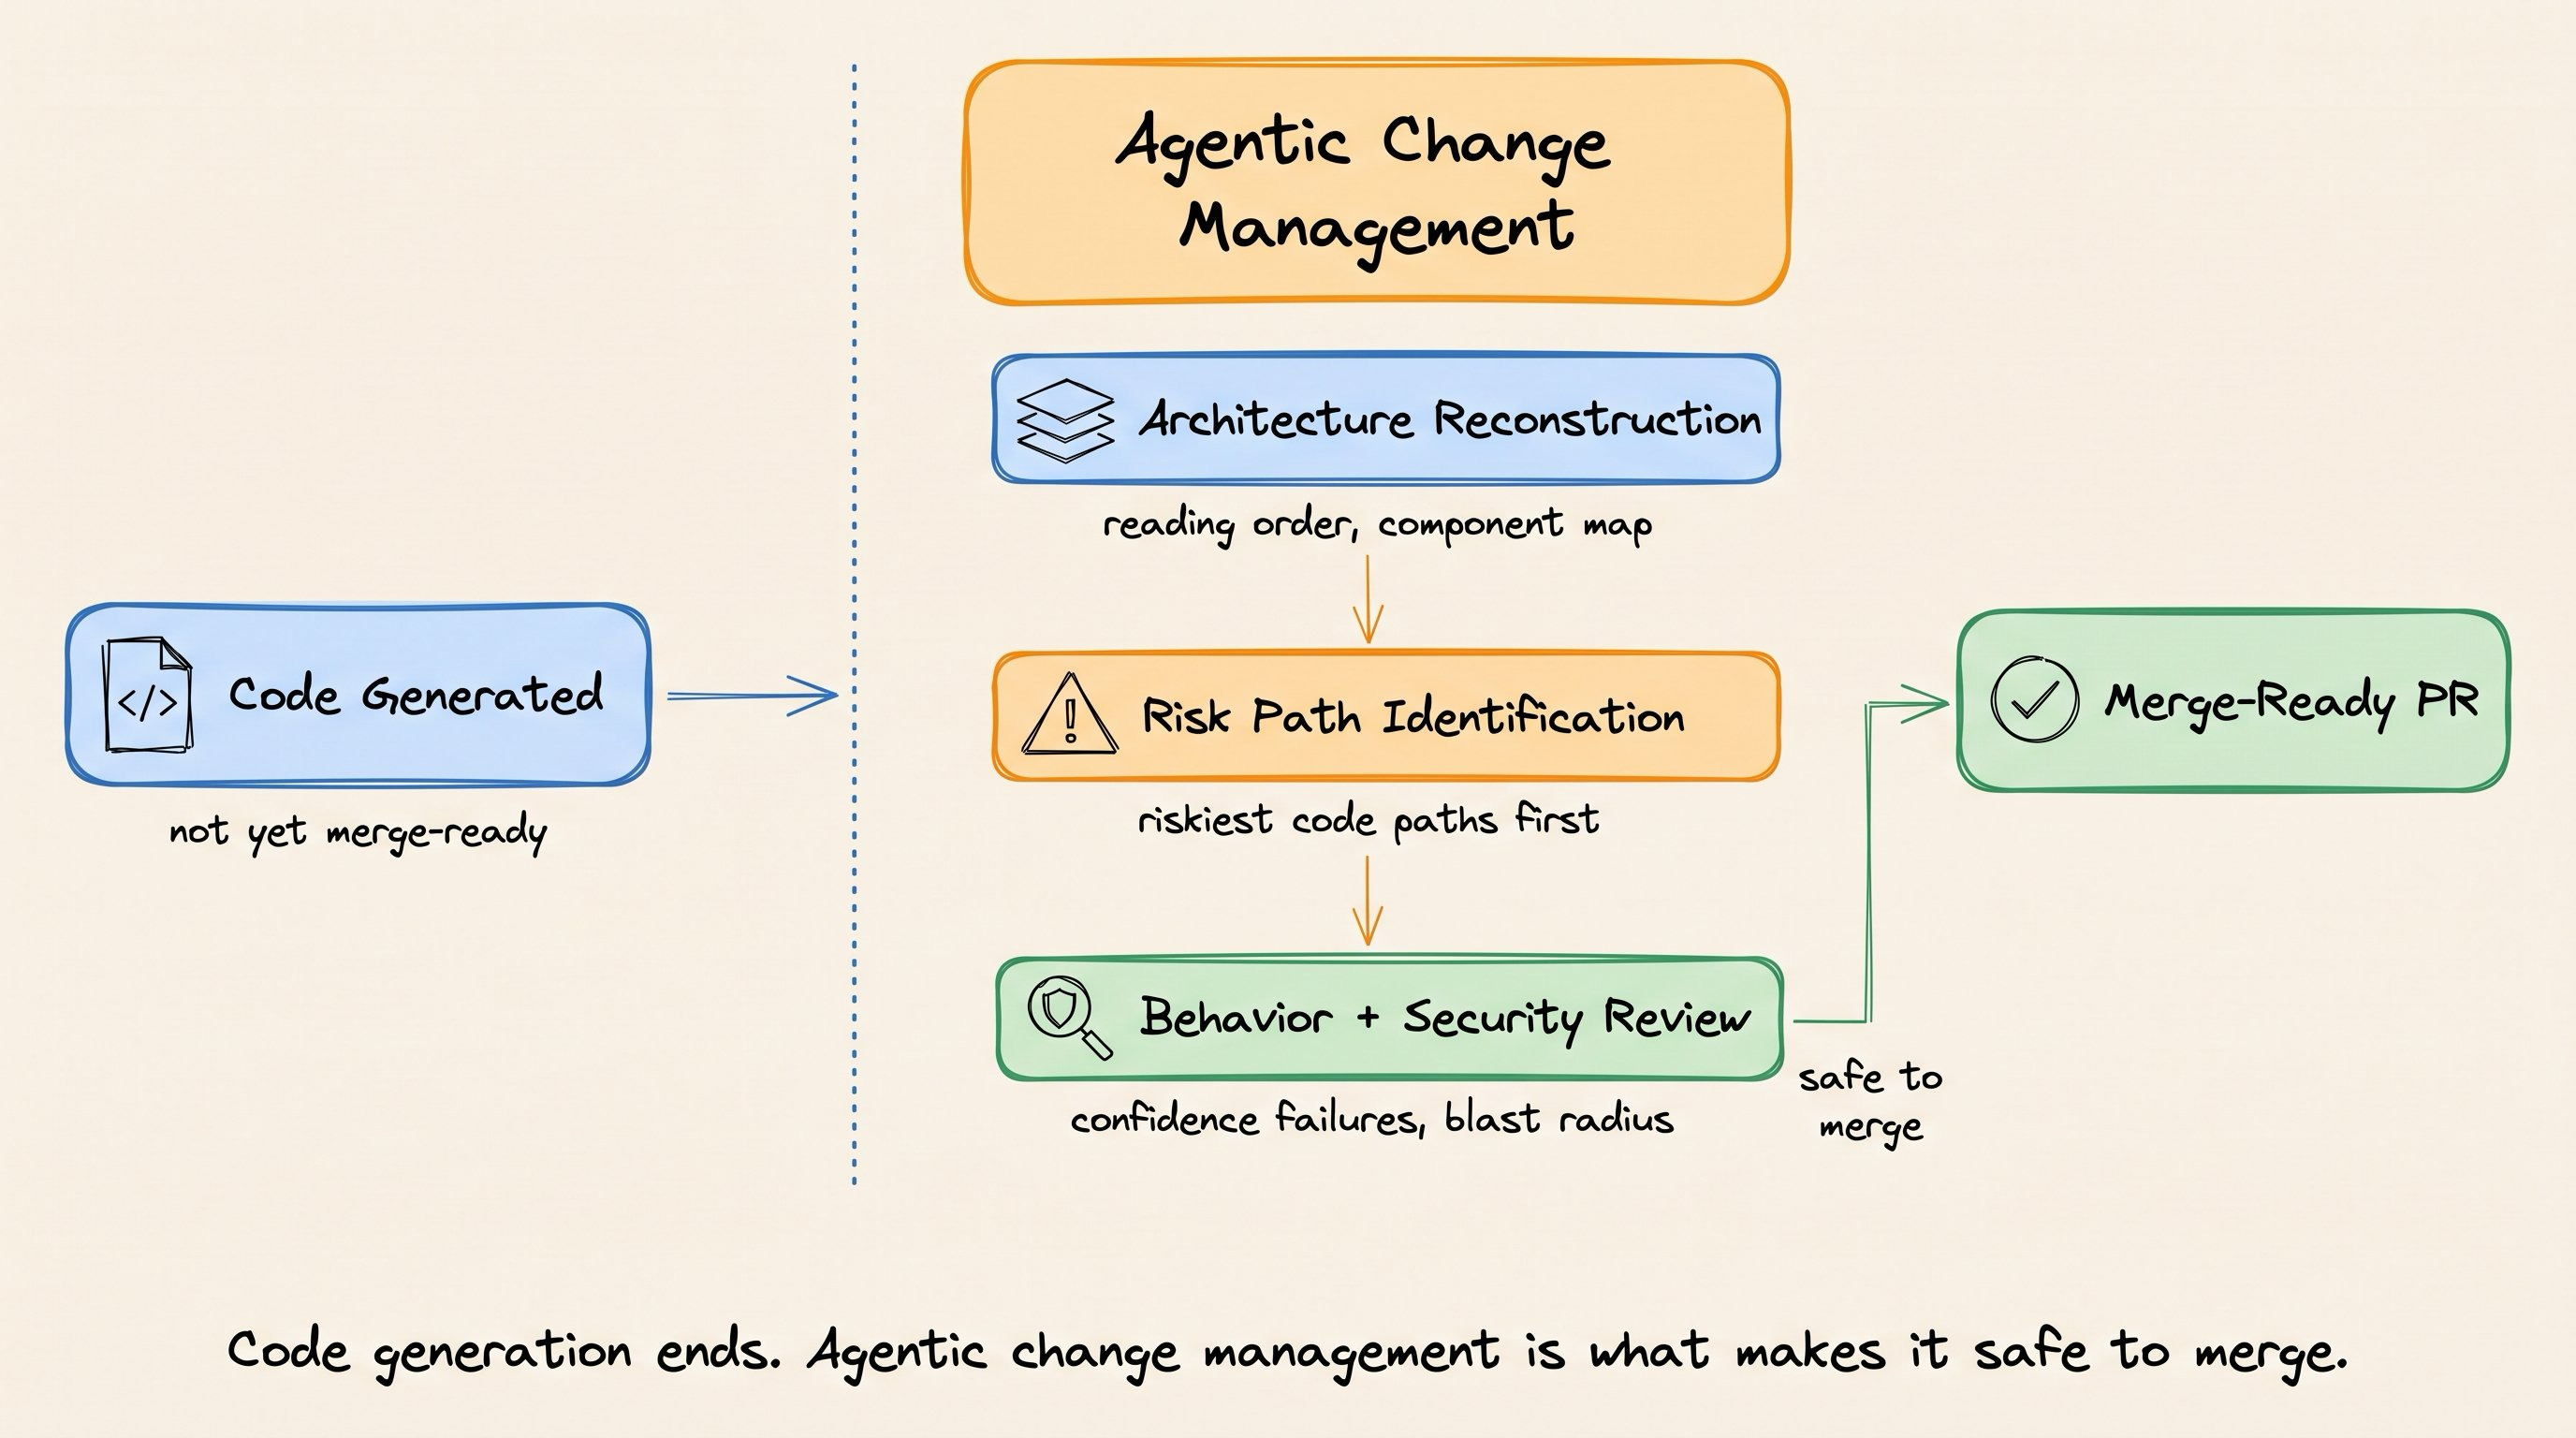
In the example, CodeRabbit reconstructed the architecture and reading order, automated review found the confidence failure, and the security blast-radius view followed external input across the API, shared state, and dashboard.
The agent ran successfully, and all 46 tests passed. Review still found an untested response that could bypass the intended confidence gate, along with a security flaw that crossed the API, shared state, and dashboard.
We built the agent in one session, then reviewed how it worked and checked for security flaws before deciding whether it was ready to merge.
You can start a free 14-day CodeRabbit trial, with no credit card required.
Ship agent-built code with confidence →
Thanks to CodeRabbit for partnering today!
How LLM inference uses GPU memory
Loading an LLM does not guarantee inference!
The model may load successfully and still run out of GPU memory when the first requests arrive.
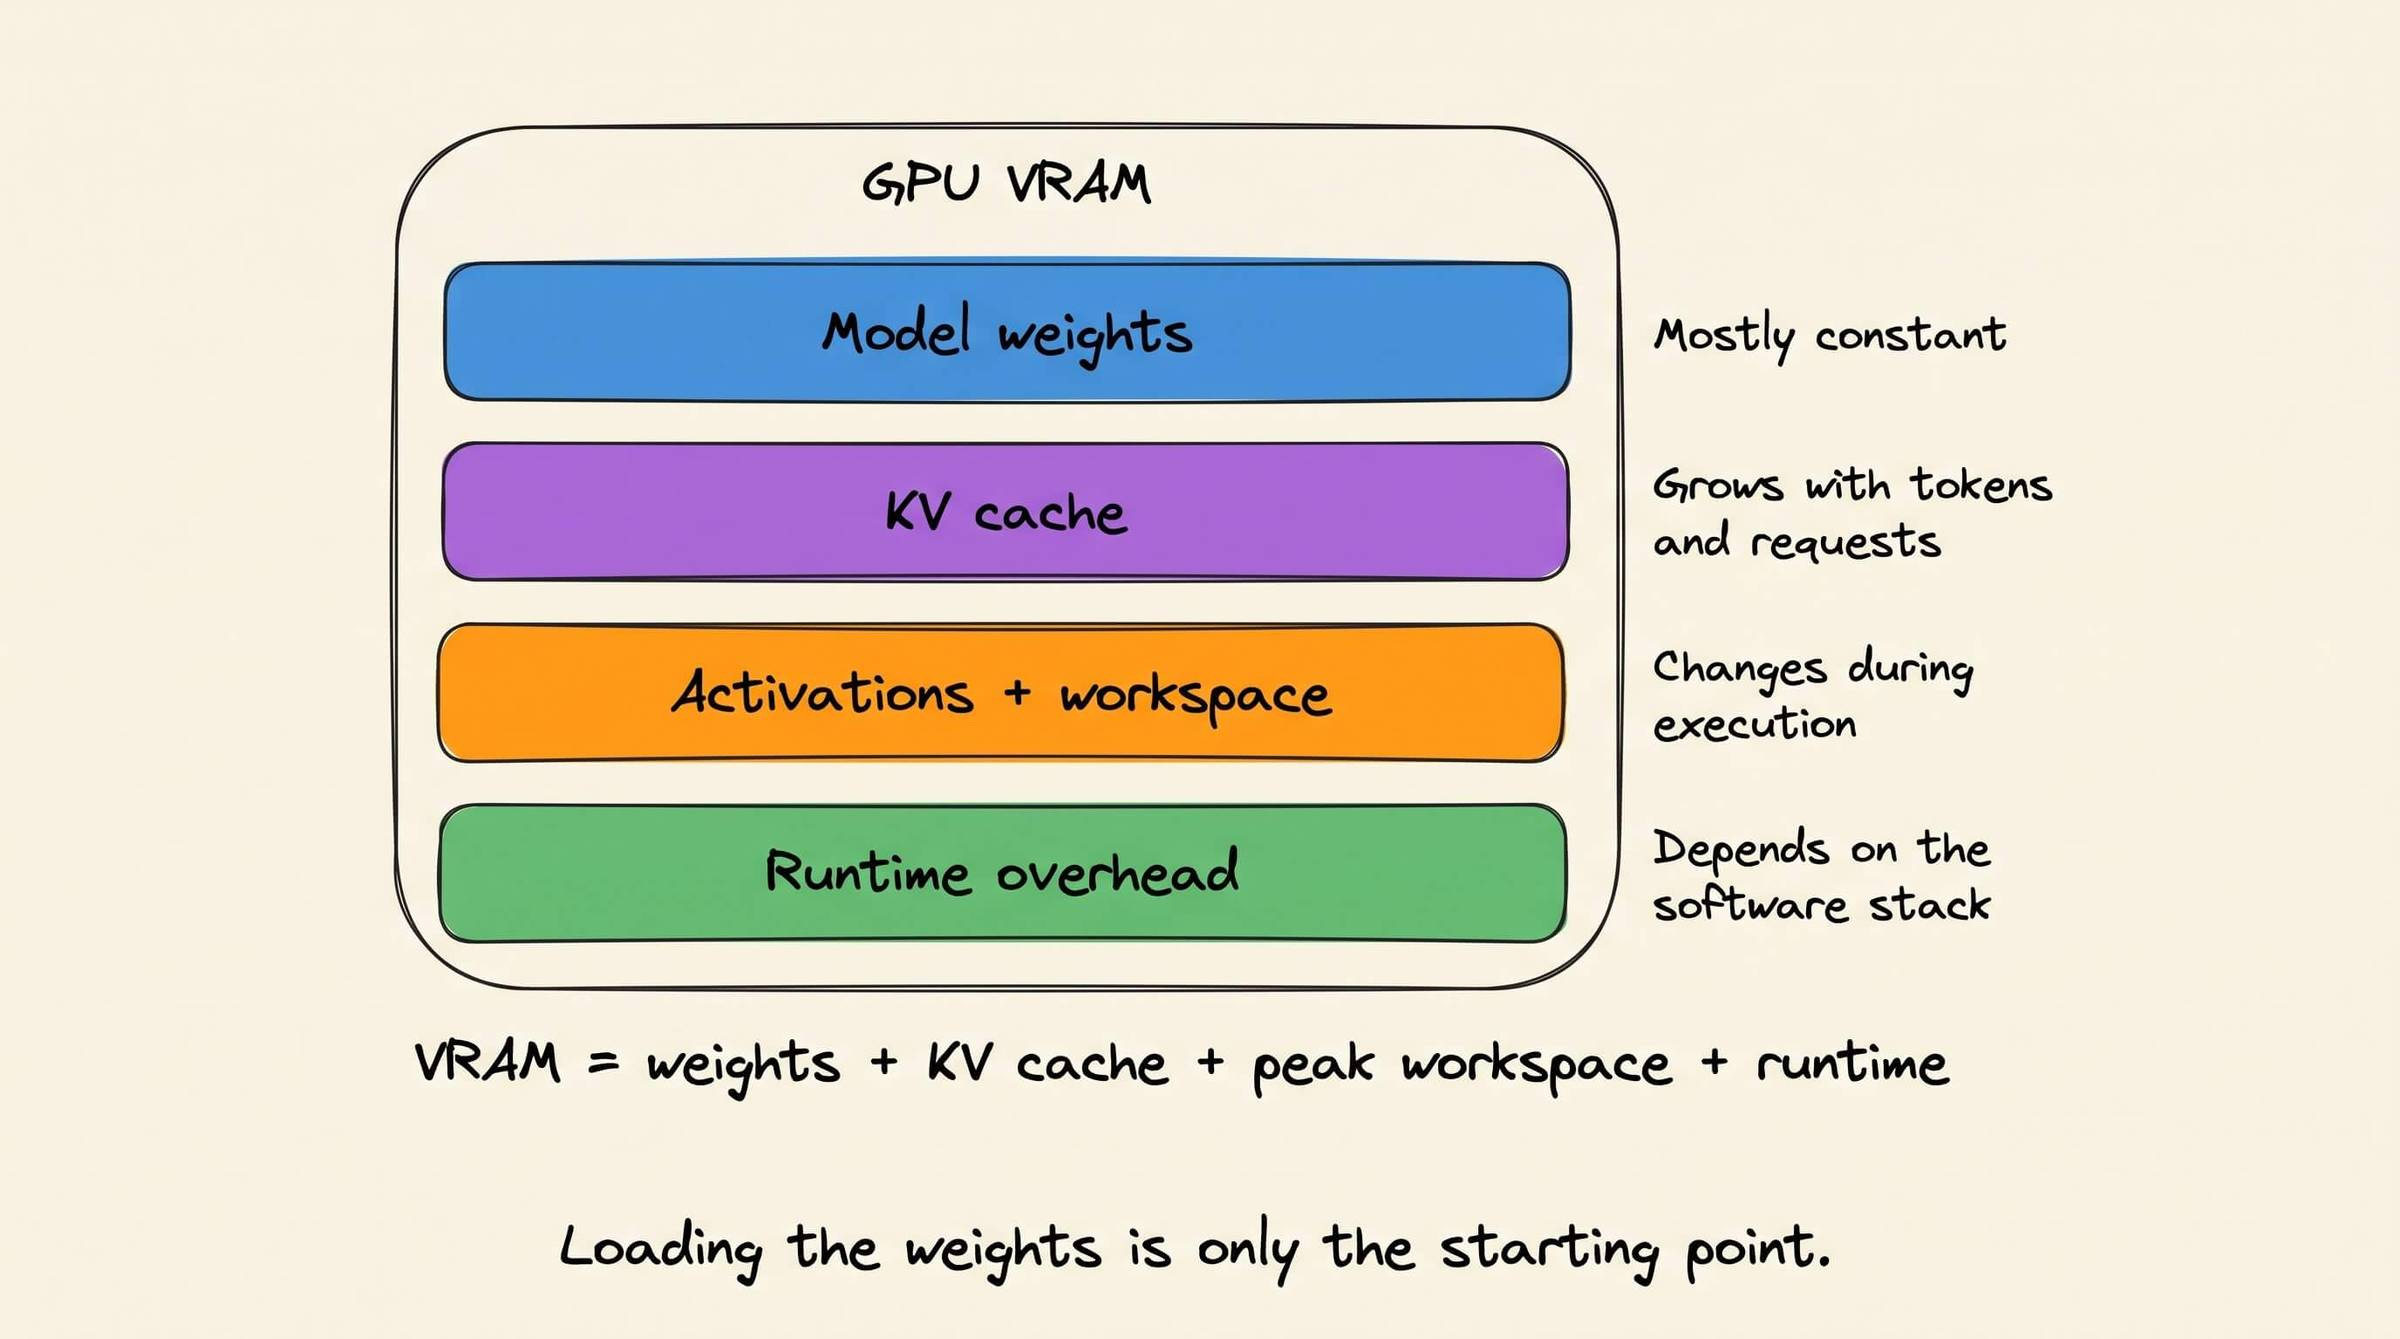
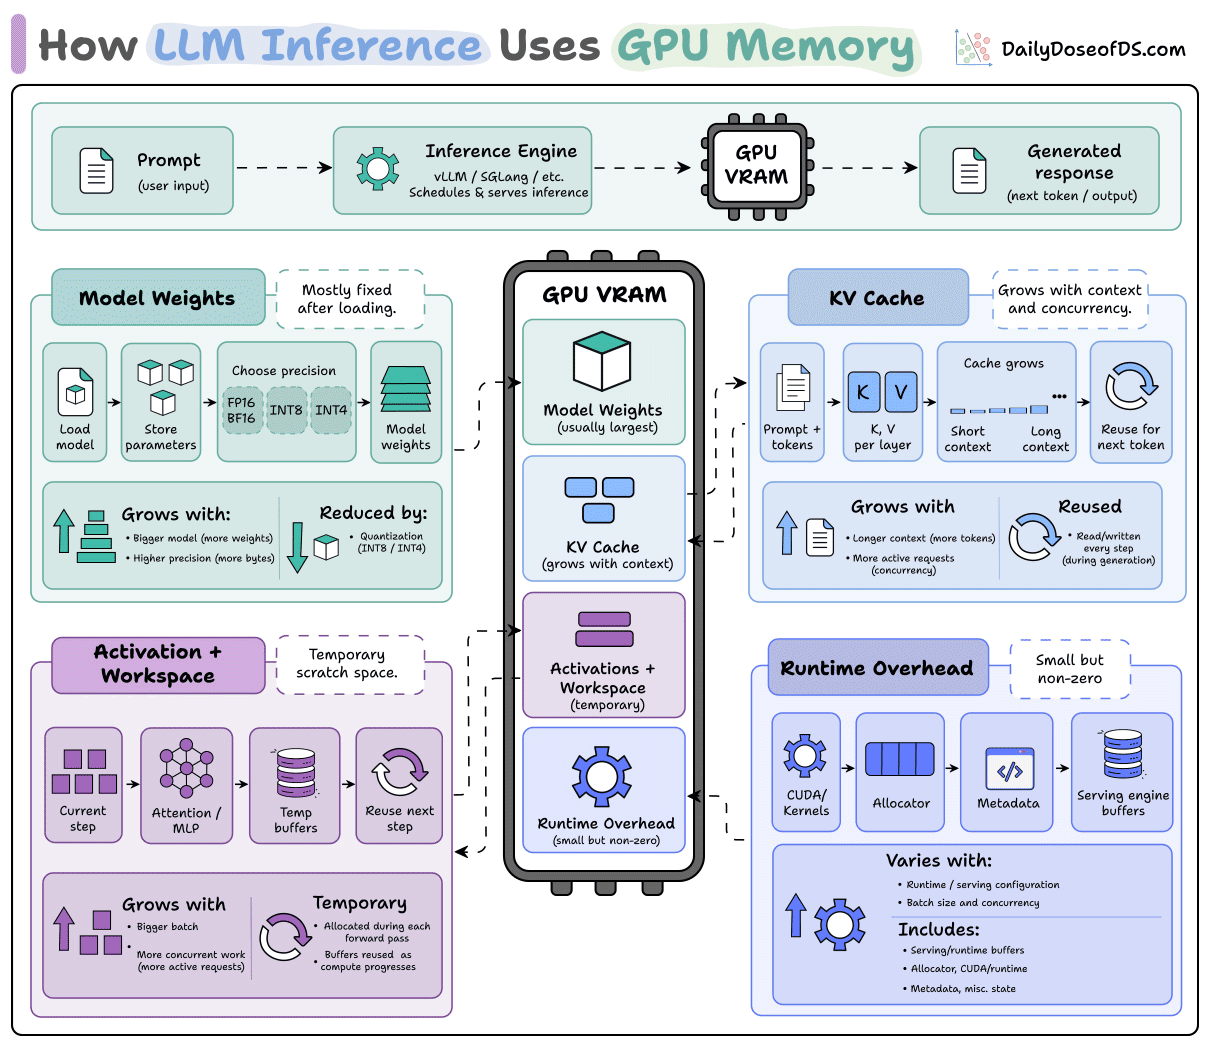
This happens because model weights are only one of four VRAM allocations:
1) Model weights
The parameters are loaded into VRAM before inference begins.
Ignoring quantization metadata and implementation overhead, a 70B parameter model requires approximately:
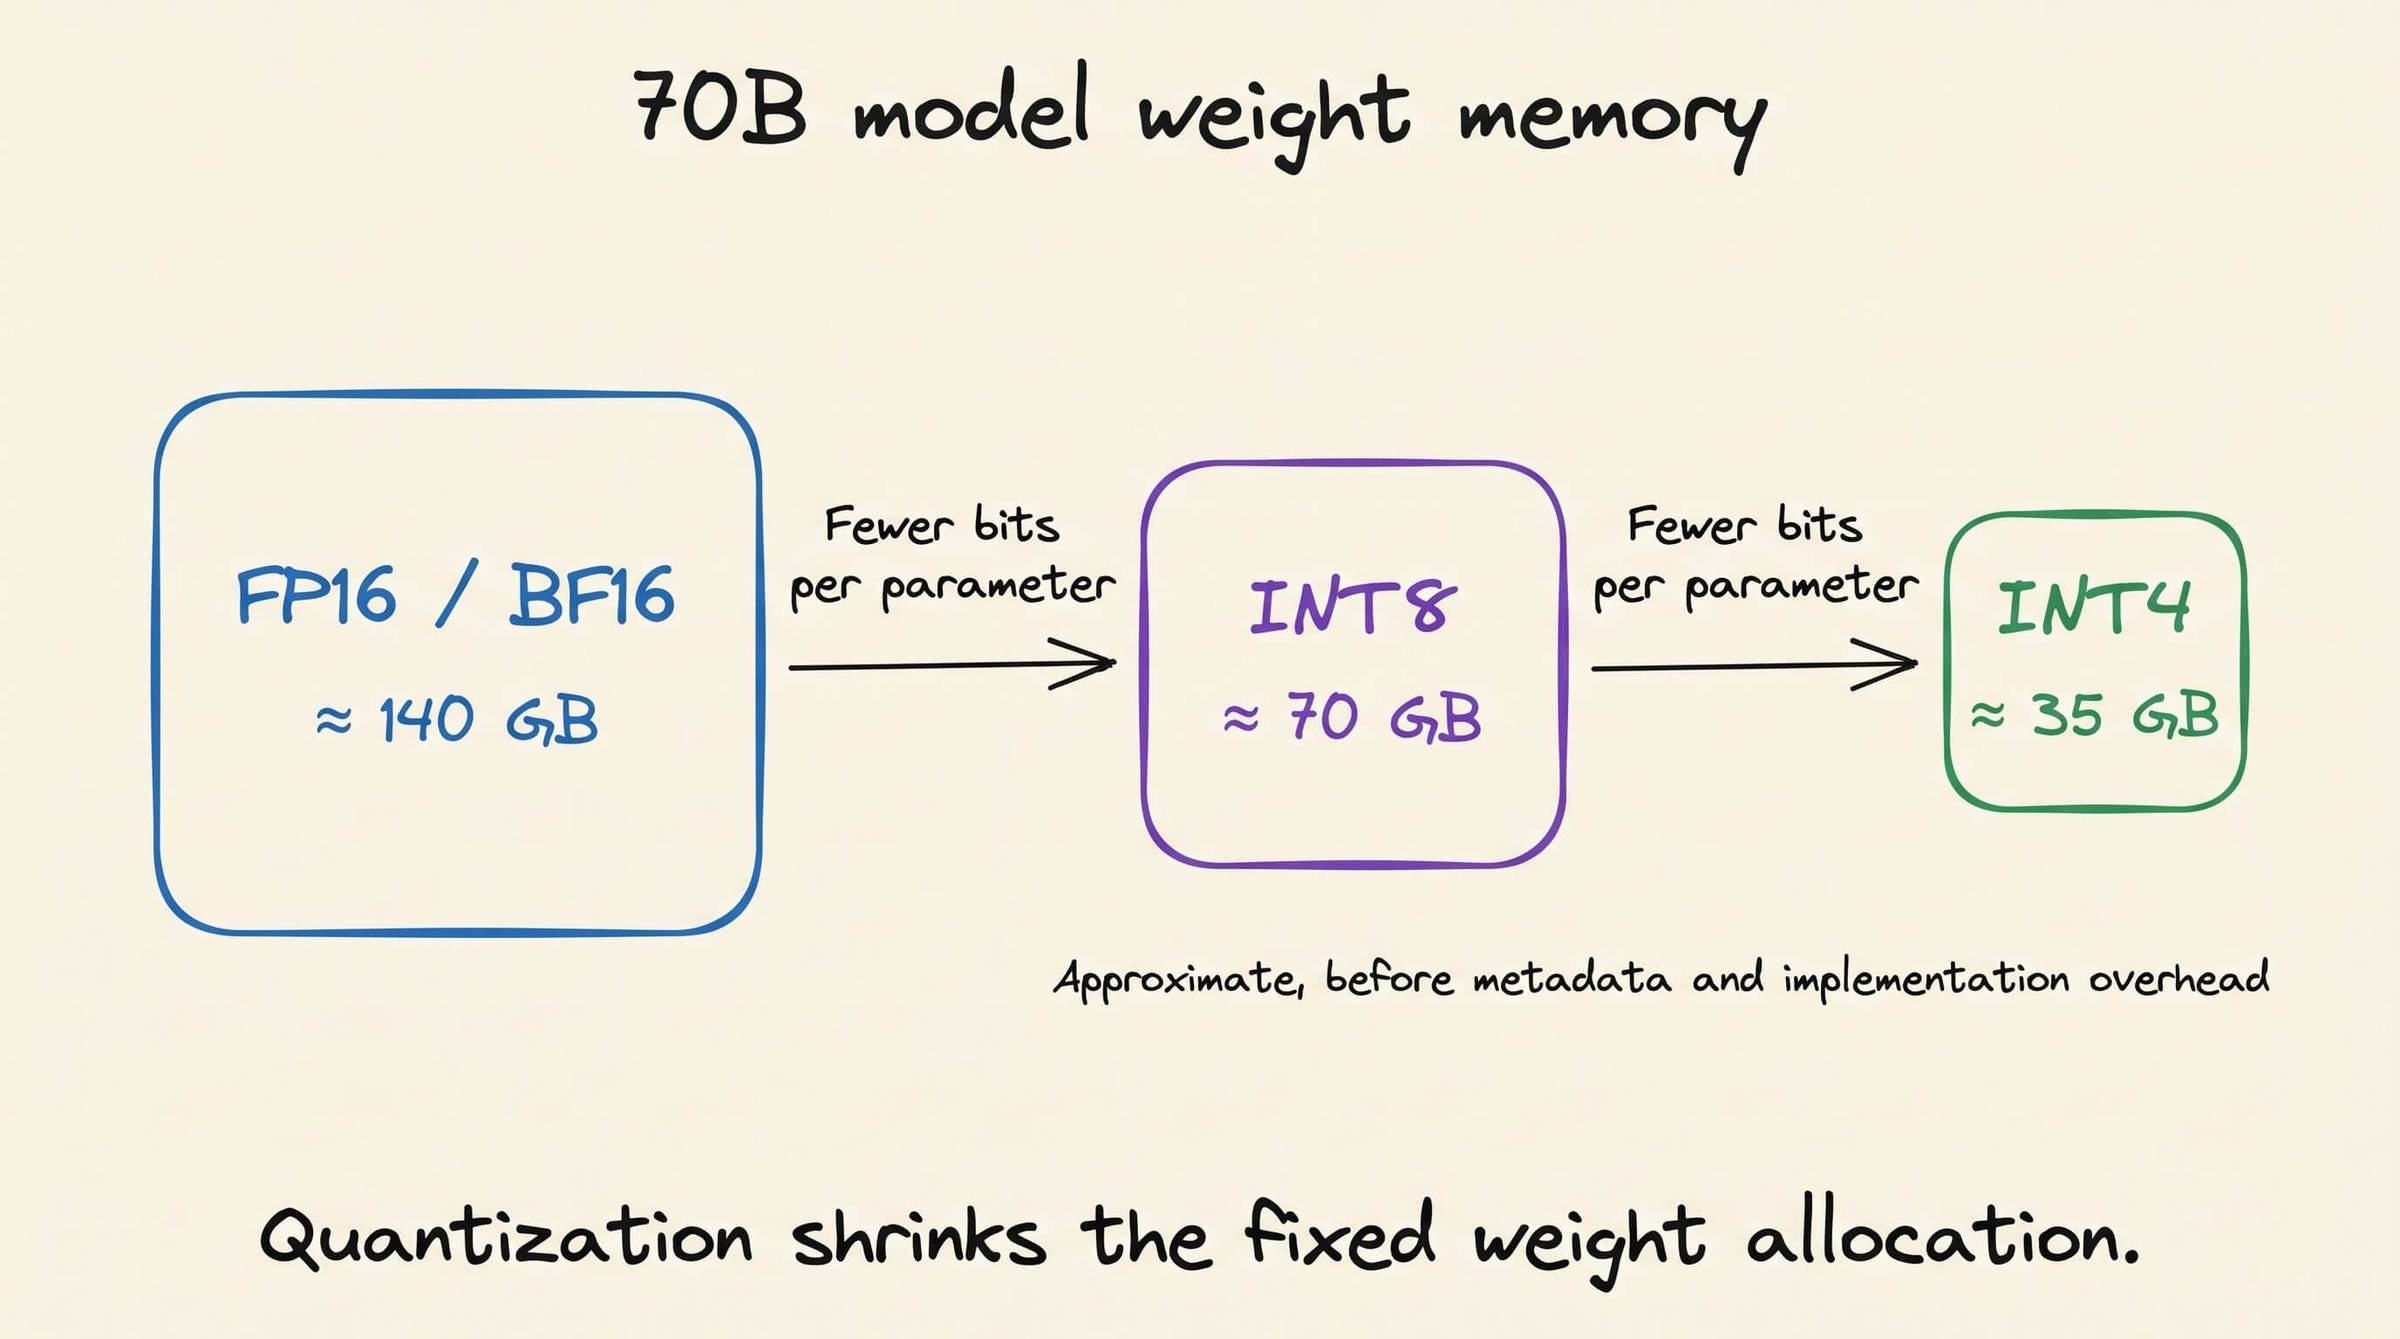
→ 140 GB in FP16 or BF16
→ 70 GB in INT8
→ 35 GB in INT4
This allocation remains mostly constant during inference.
Quantization reduces it by storing each parameter with fewer bits. However, kernels may use higher-precision values for some operations.
2) KV cache
Each Transformer layer generates KV tensors for every processed token.
The inference engine retains these tensors so new tokens can attend to earlier tokens without recomputing their key and value projections.
The approximate KV cache memory per token is:
2 × layers × KV heads × head dimension × bytes per value
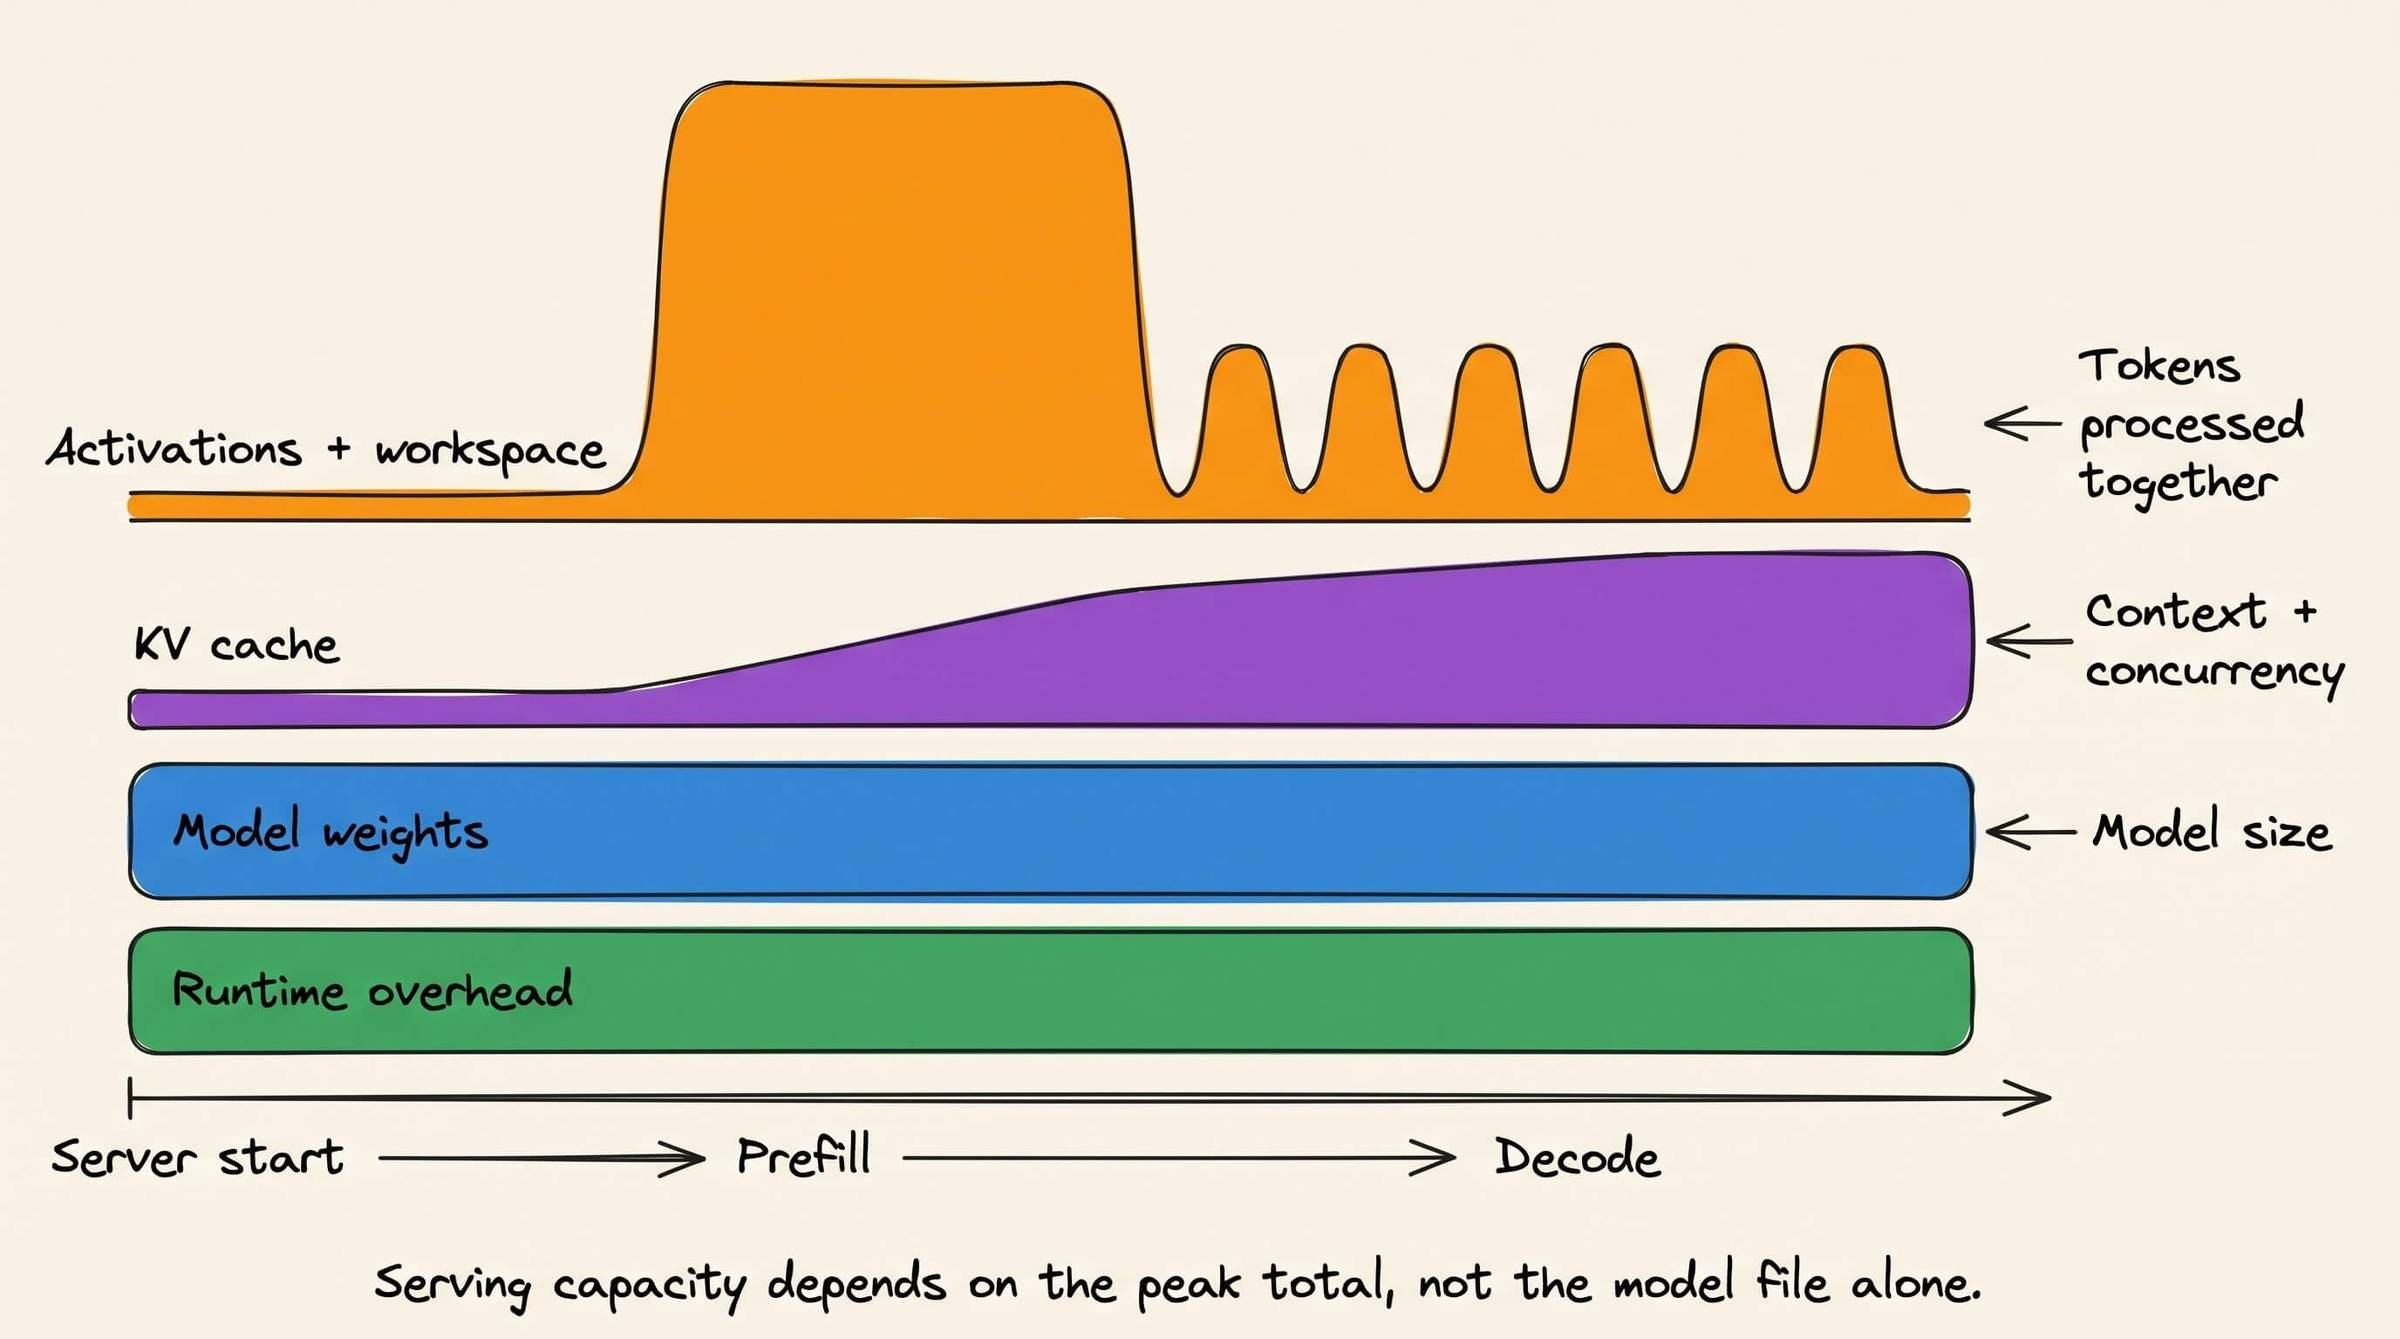
The factor of two represents the key and value tensors.
This allocation increases with context length and the number of active requests.
Grouped-query attention and multi-query attention reduce it by sharing fewer key-value heads across multiple query heads.
3) Activations and workspace
A forward pass creates intermediate tensors for attention, MLP operations, normalization, and matrix multiplication.
GPU kernels may also require temporary workspace for computation.
The inference engine reuses much of this memory across layers and generation steps.
Its peak size depends on the model architecture, number of tokens processed together, selected kernels, and serving configuration.
Prefill processes multiple prompt tokens in parallel.
Decode usually processes one new token per active request.
The two phases therefore have different activation and workspace requirements.
4) Runtime overhead
CUDA contexts, loaded kernels, memory allocators, metadata, communication buffers, and serving-engine state also consume VRAM.
The amount varies across runtimes and deployment configurations.
Memory fragmentation can also leave enough total free VRAM but no sufficiently large contiguous region for a new allocation.
The total memory requirement is:
model weights + KV cache + peak activations and workspace + runtime overhead
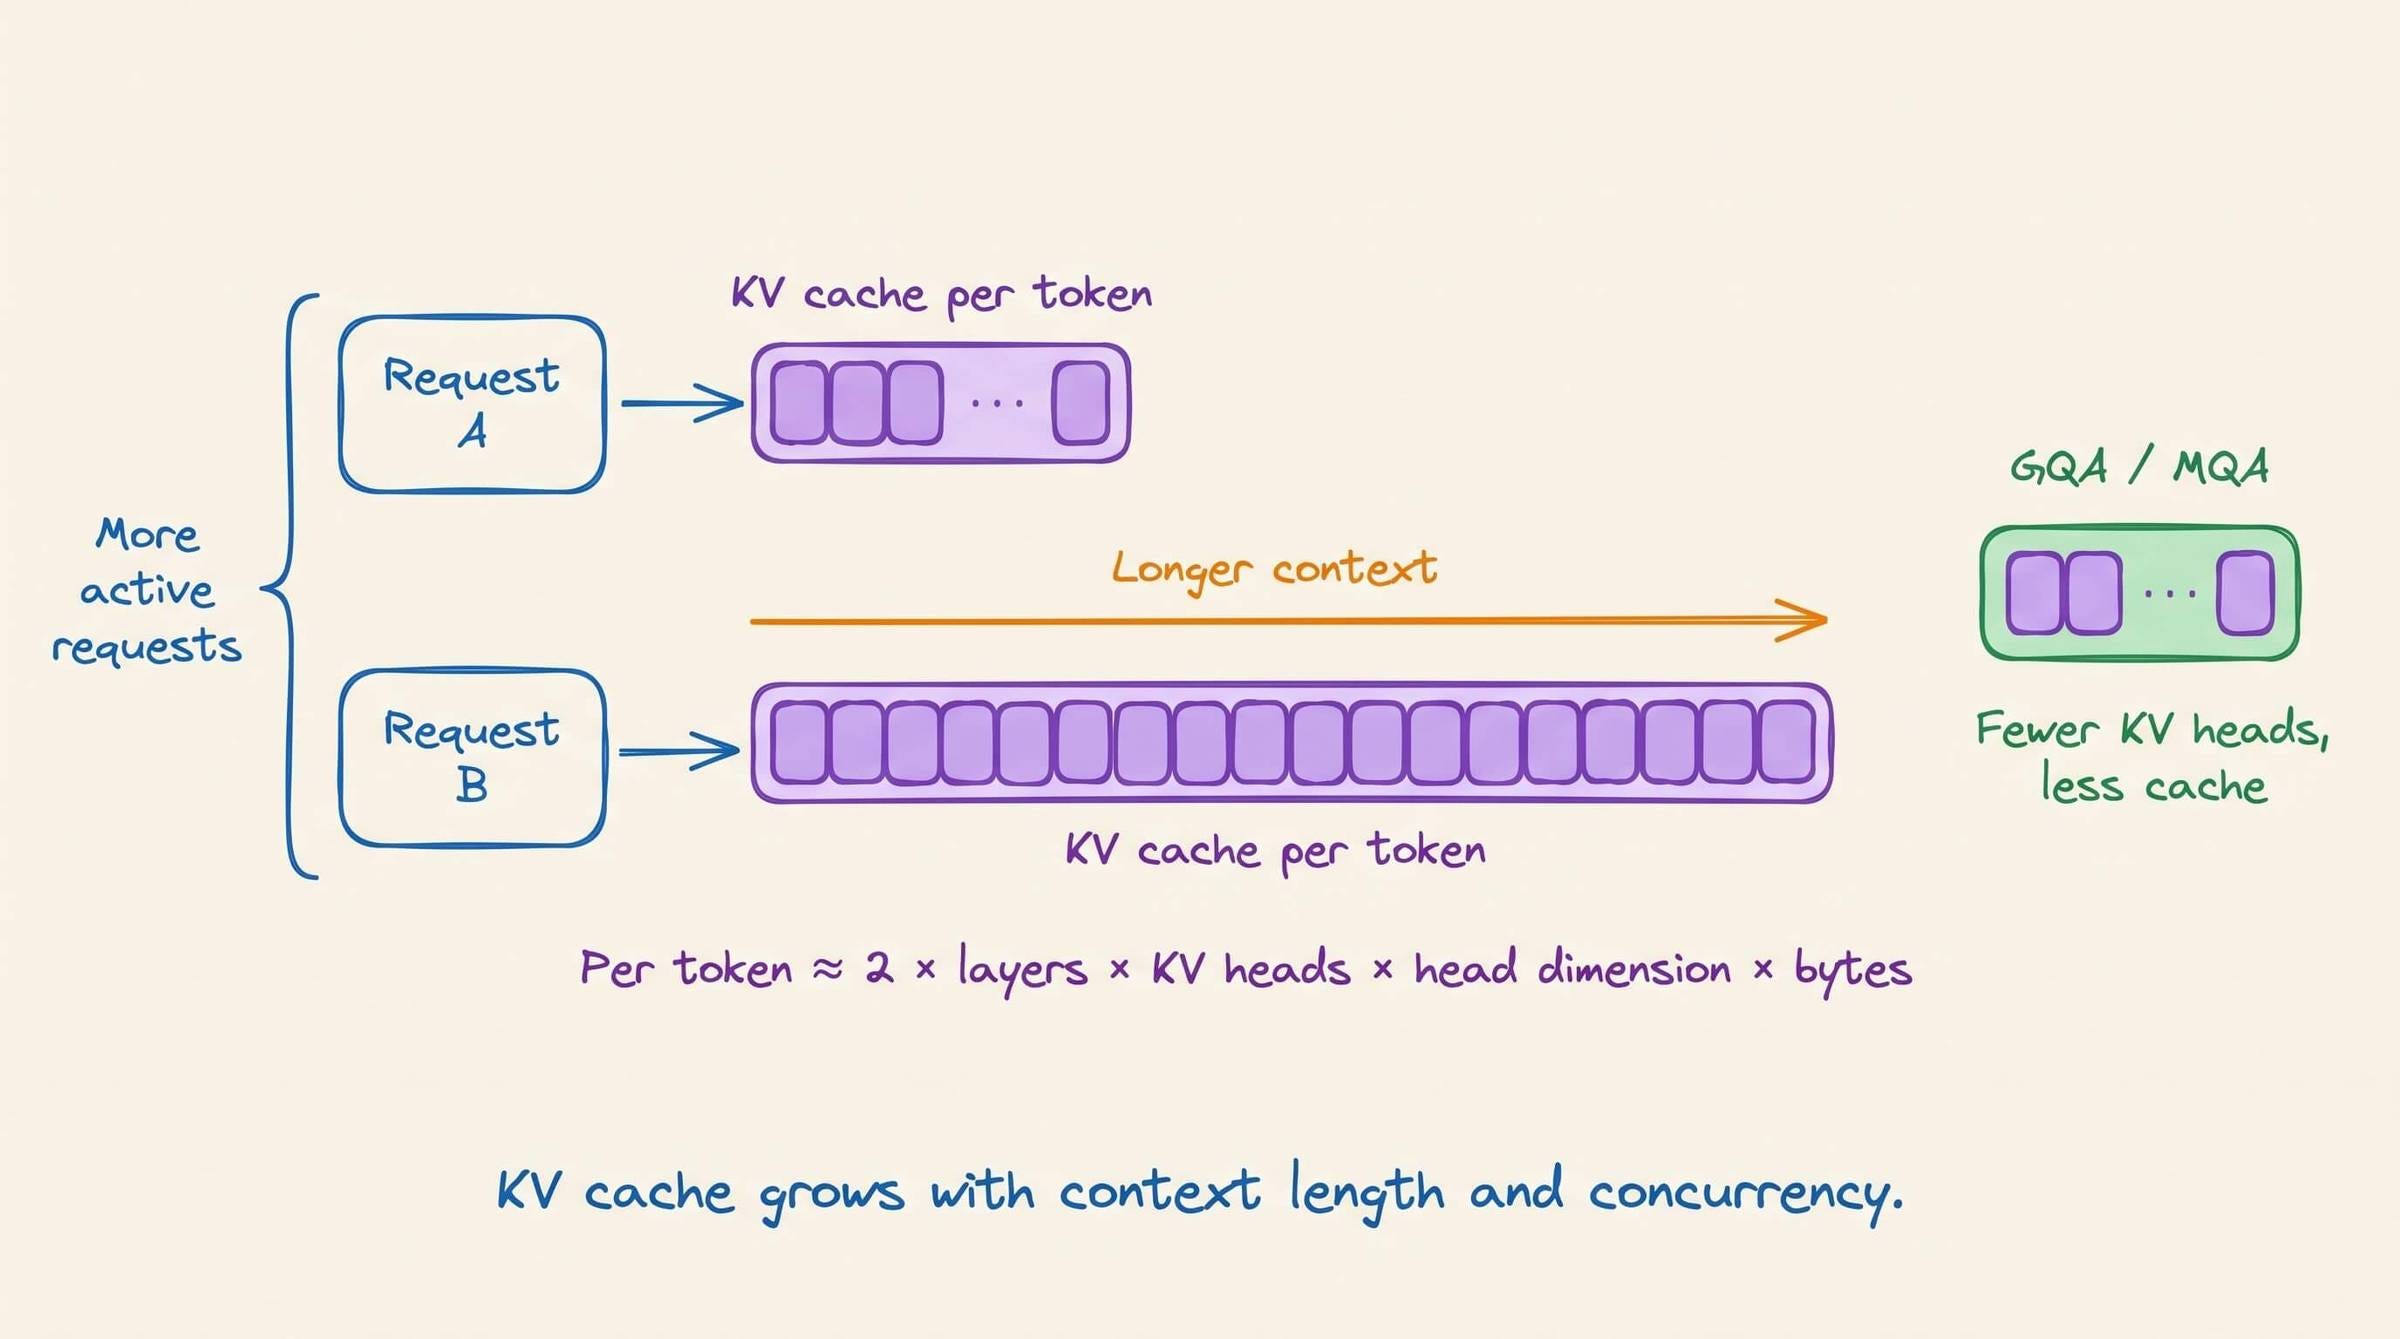
Model weights remain mostly constant.
KV cache memory increases with context length and concurrency.
Activation and workspace usage changes during execution.
Runtime overhead depends on the software stack.
This is why model size alone cannot determine whether an LLM can serve a given workload.
The visual below shows when each allocation is created, how long it remains in memory, and which workload parameters increase it.
Good day!