A Visual and Intuitive Guide to KL Divergence
Support visual inspection with quantitative measures.
Before we begin modeling, we typically hypothesize a distribution for the target variable.
We also looked at this in a recent deep dive into generalized linear models (GLMs).
Read it here if you haven’t yet: Generalized Linear Models (GLMs): The Supercharged Linear Regression.
There, we formulated every GLM by assuming a distribution for the target variable.
While visual inspection is often helpful, this approach is quite subjective and may lead to misleading conclusions.
Thus, it is essential to be aware of quantitative measures as well.
KL divergence is one such reliable measure.
It quantifies the difference between two probability distributions.
The core idea is to assess how much information is lost when one distribution is used to approximate another.
Thus, the more information is lost, the more the KL Divergence. As a result, the more the dissimilarity.
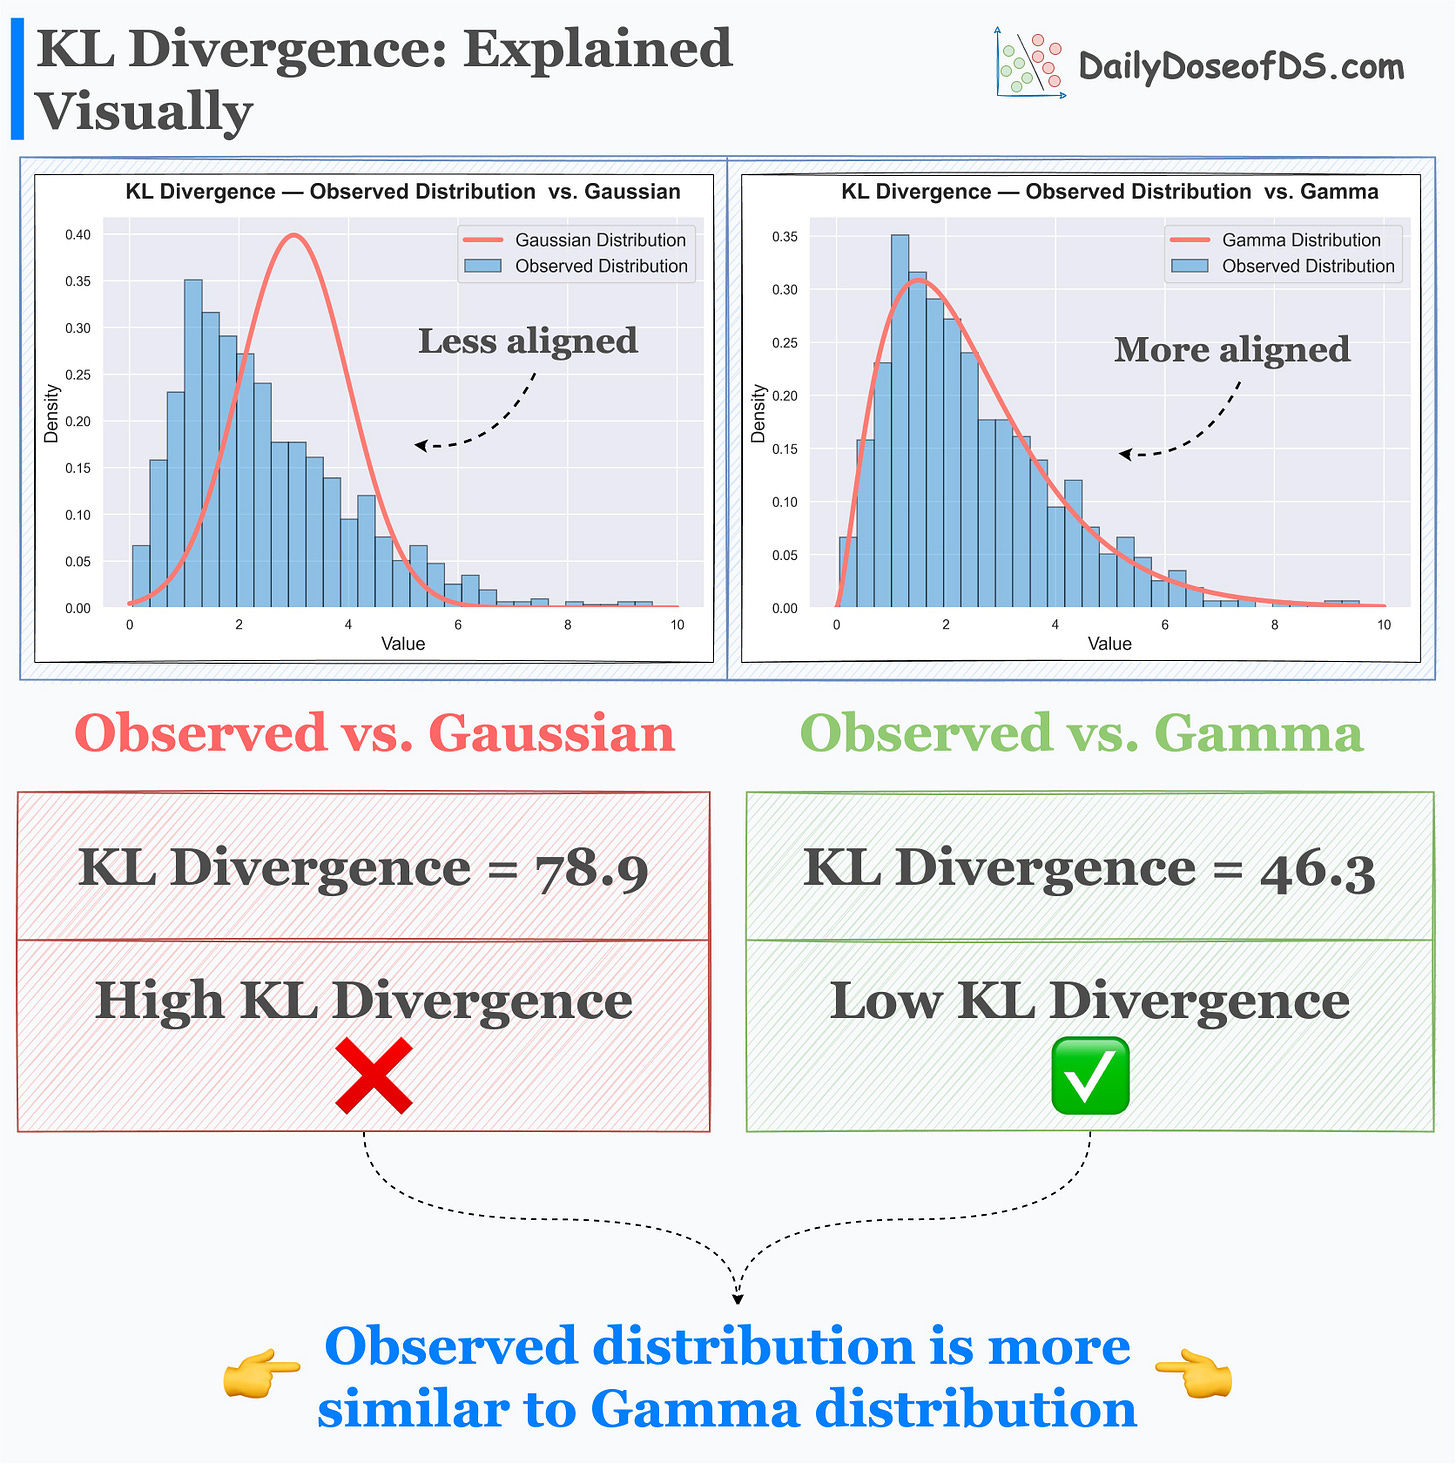
Its effectiveness is evident from the image below.
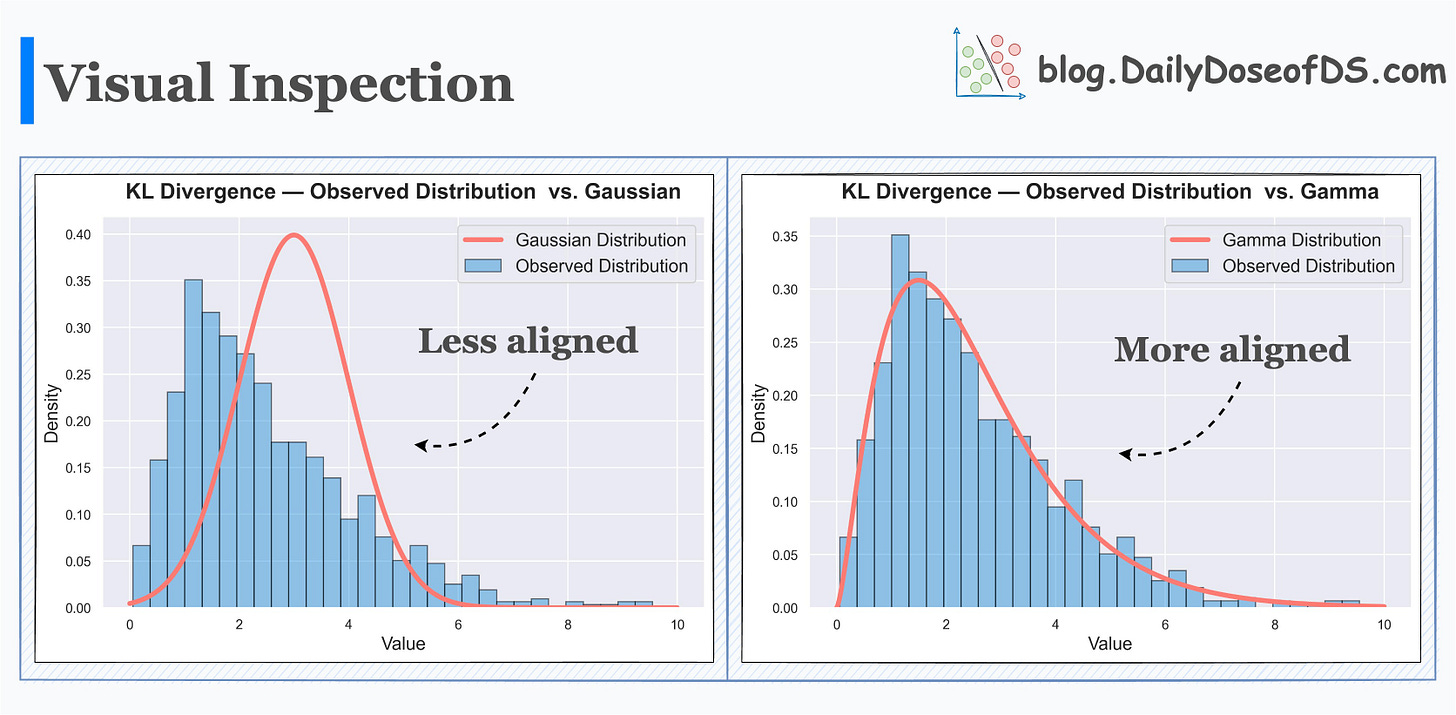
Here, we have an observed distribution. Next, we hypothesize that the true distribution could have been:
Gamma distribution, or
Gaussian distribution
Visual inspection hints that the true distribution does not appear to be a Gaussian. Rather it’s more like a Gamma distribution.
The results of KL Divergence confirm this by quantifying the dissimilarity between them.
Observed distribution and Gamma distribution → This has low KL Divergence.
Observed distribution and Gaussian distribution → This has high KL Divergence.
High KL Divergence indicates more dissimilarity.
There are many applications of KL Divergence:
We can simplify complex distributions to simple ones if the divergence is low.
It is often utilized in training generative models like variational autoencoders (VAEs) and generative adversarial networks (GANs).
And many more.
Read the GLMs article here: Generalized Linear Models (GLMs): The Supercharged Linear Regression.
👉 Over to you: What are some other measures you use in such situations?
👉 If you liked this post, don’t forget to leave a like ❤️. It helps more people discover this newsletter on Substack and tells me that you appreciate reading these daily insights. The button is located towards the bottom of this email.
Thanks for reading :)
Whenever you’re ready, here are a couple of more ways I can help you:
Get the full experience of the Daily Dose of Data Science. Every week, receive two curiosity-driven deep dives that:
Make you fundamentally strong at data science and statistics.
Help you approach data science problems with intuition.
Teach you concepts that are highly overlooked or misinterpreted.
Promote to 31,000 subscribers by sponsoring this newsletter.
👉 Tell the world what makes this newsletter special for you by leaving a review here :)
👉 If you love reading this newsletter, feel free to share it with friends!


I think maximum likelihood would be a better method in this case. How would you even calculate the KL divergence between a continuous distribution (the estimated distribution) and a discrete (sample) distribution?