An Underrated Technique to Visually Assess Linear Regression Performance
Assumption turned into performance validation.
Linear regression assumes that the model residuals (=actual-predicted) are normally distributed.
If the model is underperforming, it may be due to a violation of this assumption.
Here, I often use a residual distribution plot to verify this and determine the model’s performance.
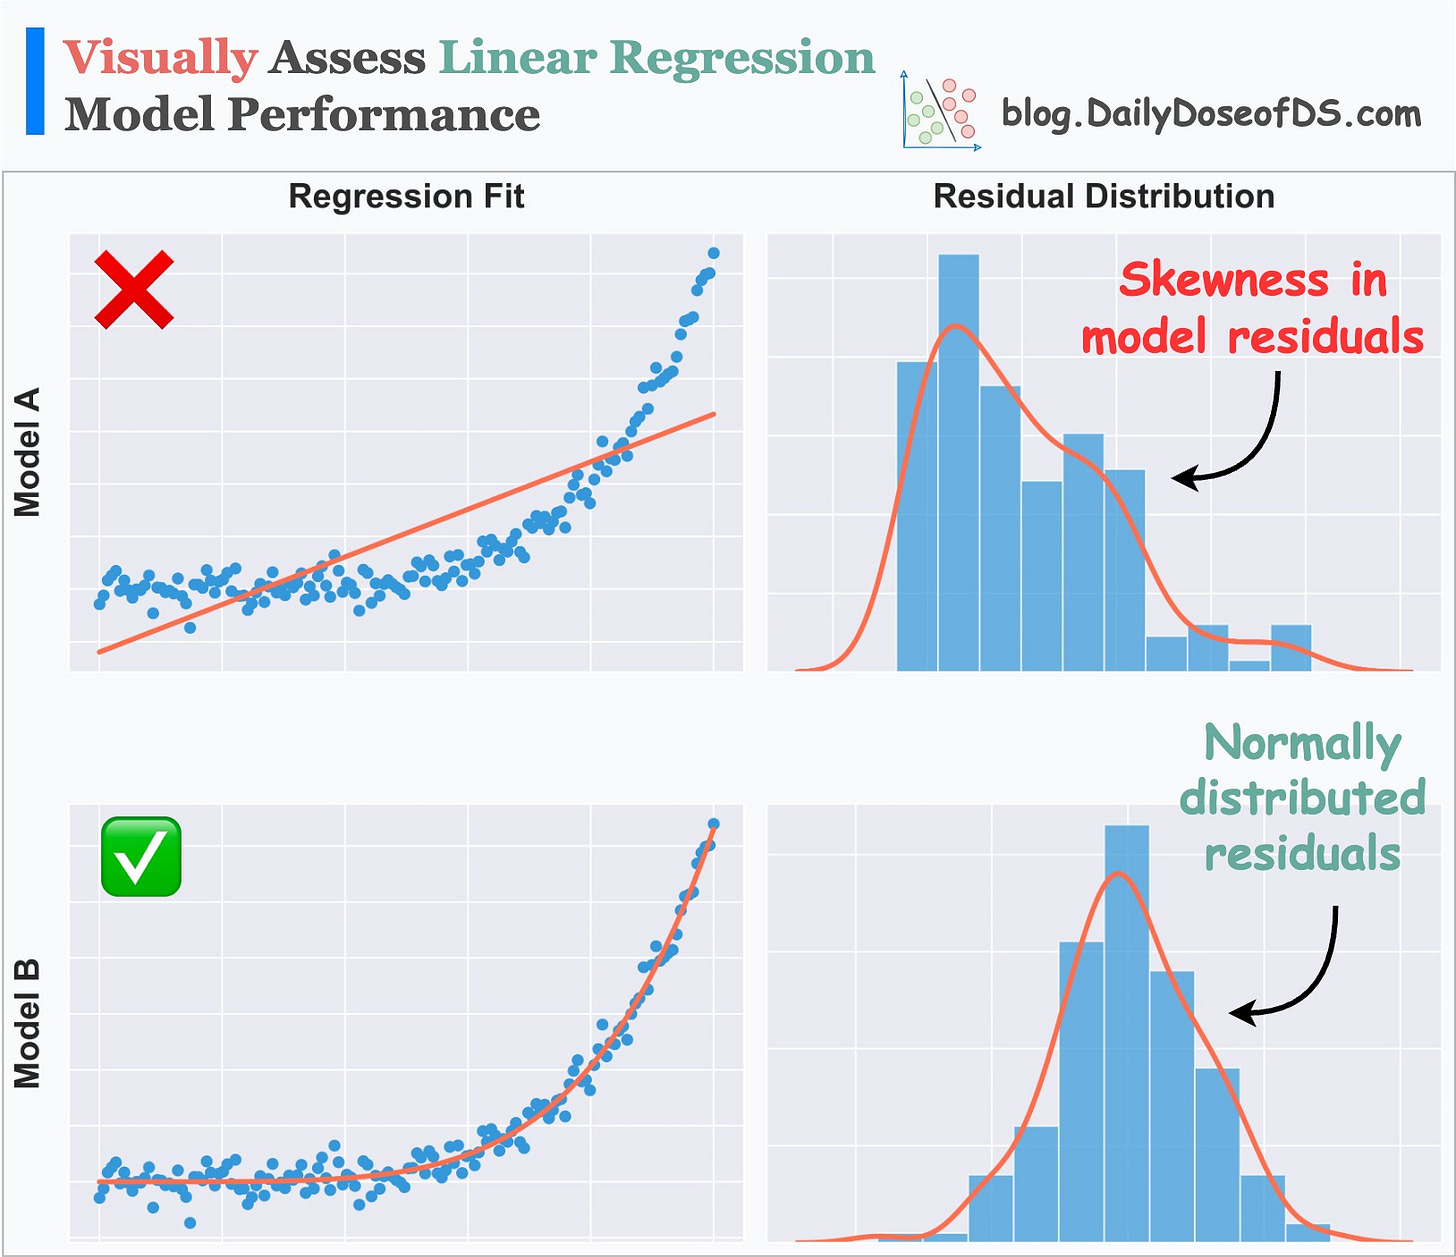
As the name suggests, this plot depicts the distribution of residuals (=actual-predicted), as shown below:
A good residual plot will:
Follow a normal distribution
NOT reveal trends in residuals
A bad residual plot will:
Show skewness
Reveal patterns in residuals
Thus, the more normally distributed the residual plot looks, the more confident we can be about our model.
This is especially useful when the regression line is difficult to visualize, i.e., in a high-dimensional dataset.
Why?
Because a residual distribution plot depicts the distribution of residuals, which is always one-dimensional.
Thus, it can be plotted and visualized easily.
Of course, this was just about validating one assumption — the normality of residuals.
However, linear regression relies on many other assumptions, which must be tested as well.
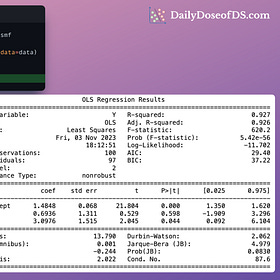
Statsmodel provides a pretty comprehensive report for this:
Read the following issue if you want to learn how to interpret this report:
Statsmodel Regression Summary Will Never Intimidate You Again
Statsmodel provides one of the most comprehensive summaries for regression analysis. Yet, I have seen so many people struggling to interpret the critical model details mentioned in this report. Today, let me help you understand the entire summary support provided by statsmodel and why it is so important.
And if you want to learn where the assumptions originate from, then read this deep dive.
👉 Over to you: What are some other ways/plots to determine the linear model’s performance?
👉 If you liked this post, don’t forget to leave a like ❤️. It helps more people discover this newsletter on Substack and tells me that you appreciate reading these daily insights.
The button is located towards the bottom of this email.
Thanks for reading!
Latest full articles
If you’re not a full subscriber, here’s what you missed:
DBSCAN++: The Faster and Scalable Alternative to DBSCAN Clustering
Federated Learning: A Critical Step Towards Privacy-Preserving Machine Learning
You Cannot Build Large Data Projects Until You Learn Data Version Control!
Why Bagging is So Ridiculously Effective At Variance Reduction?
Sklearn Models are Not Deployment Friendly! Supercharge Them With Tensor Computations.
Deploy, Version Control, and Manage ML Models Right From Your Jupyter Notebook with Modelbit
Gaussian Mixture Models (GMMs): The Flexible Twin of KMeans.
To receive all full articles and support the Daily Dose of Data Science, consider subscribing:
👉 Tell the world what makes this newsletter special for you by leaving a review here :)
👉 If you love reading this newsletter, feel free to share it with friends!


As always - good consistent pack of information
Thank you so much Avi
As always - good consistent pack of information
Thank you so much Avi