Are You Misinterpreting Correlation for Predictiveness?
Here’s what you should use instead to measure predictiveness.
Correlation measures how two features vary with one another linearly (or monotonically).
This makes correlation symmetric: corr(A, B) = corr(B, A).
Yet, associations are often asymmetric.
For instance, given a date, it is easy to tell the month. But given a month, you can never tell the date.
Correlation, being symmetric, entirely ignores this notion.
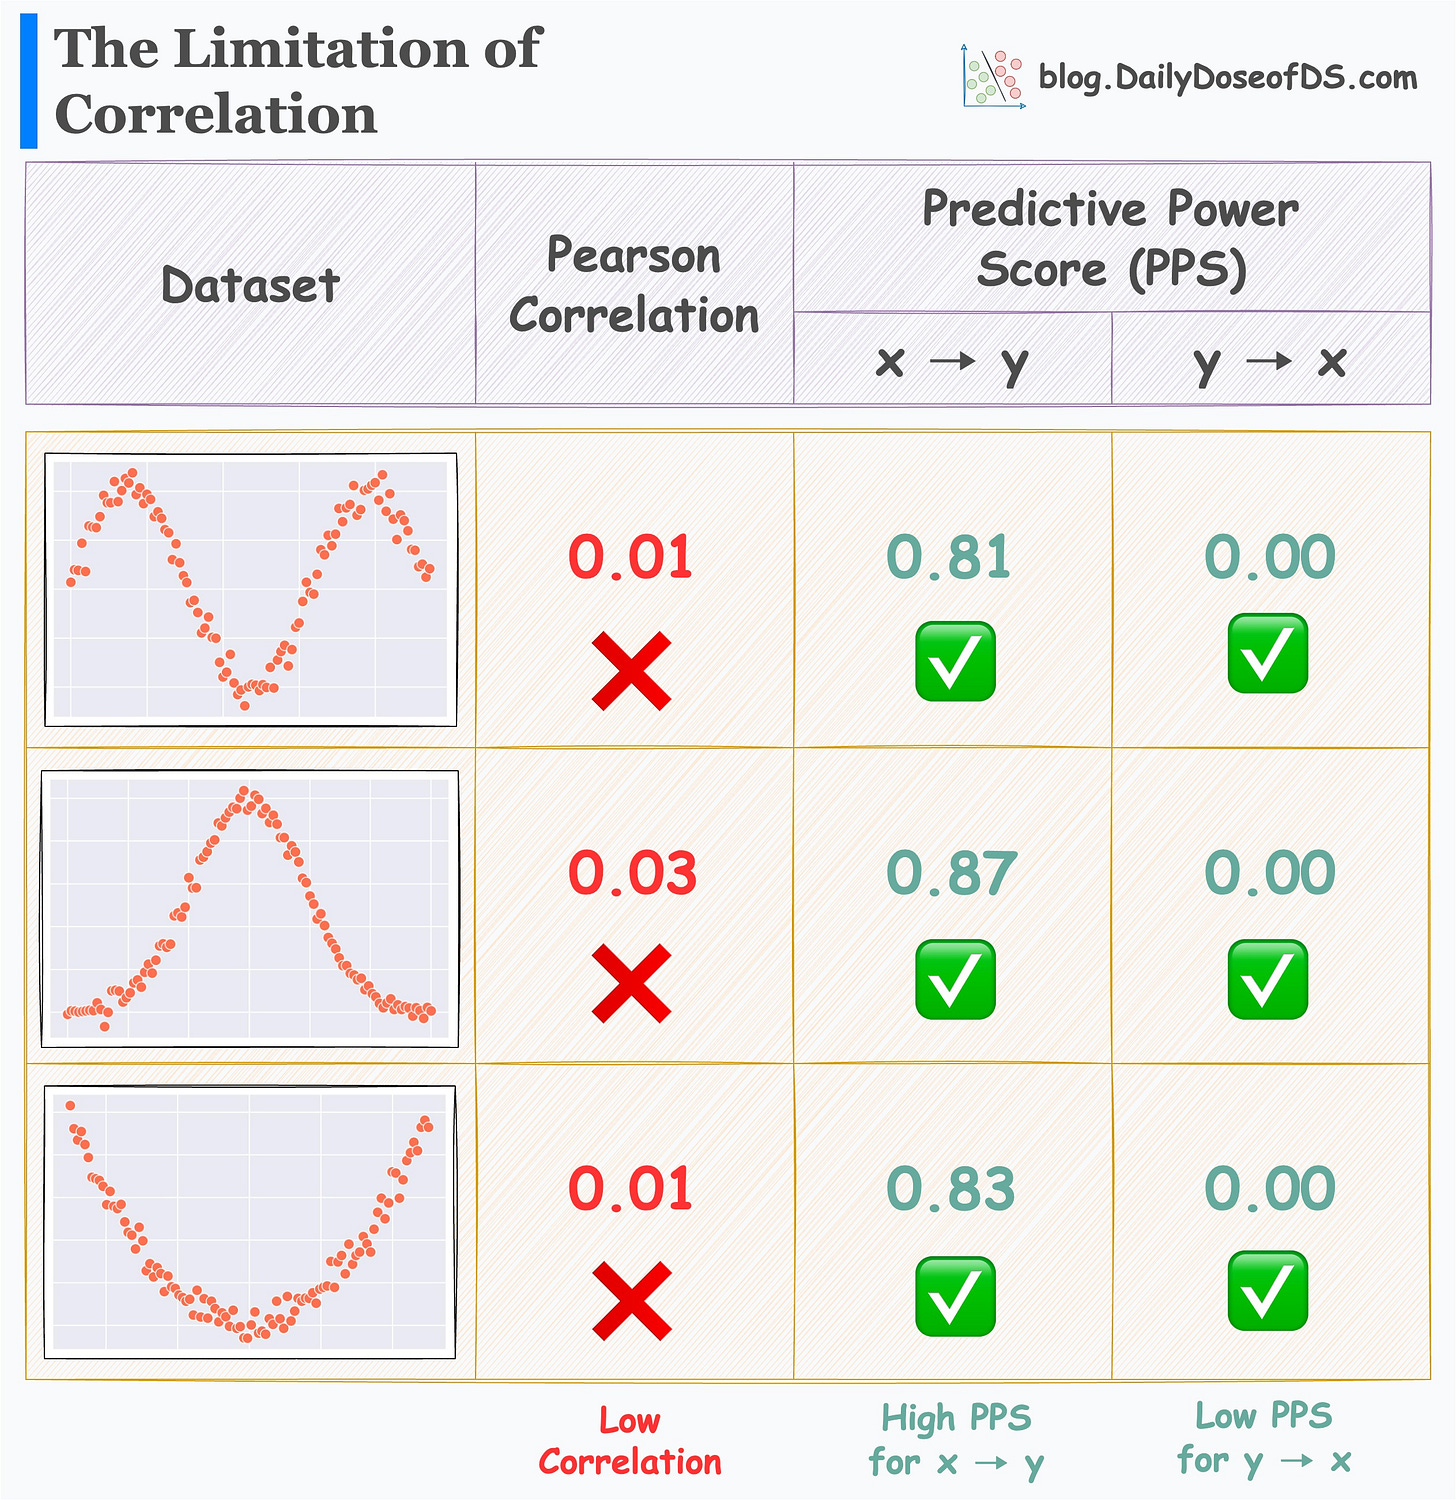
What’s more, it is not meant to quantify how well a feature can predict the outcome, as demonstrated below:
Yet, at times, it is misinterpreted as a measure of “predictiveness”.
Lastly, correlation is mostly limited to numerical data. But categorical data is equally important for predictive models.
The Predictive Power Score (PPS) addresses each of these limitations.
As the name suggests, it measures the predictive power of a feature.
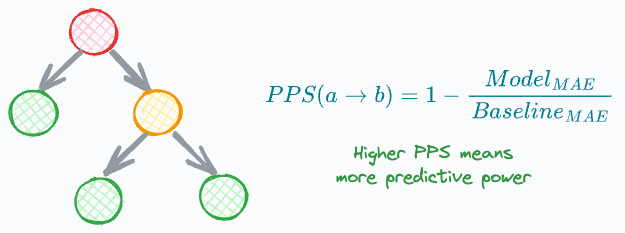
PPS(a → b) is calculated as follows:
If the target (b) is numeric:
Train a Decision Tree Regressor that predicts b using a.
Find PPS by comparing its MAE to the MAE of a baseline model (median prediction).
If the target (b) is categorical:
Train a Decision Tree Classifier that predicts b using a.
Find PPS by comparing its F1 to the F1 of a baseline model (random or most frequent prediction).
Thus, PPS:
is asymmetric, meaning
PPS(a, b) != PPS(b, a).can be used on categorical targets (b).
can be used to measure the predictive power of categorical features (a).
works well for linear and non-linear relationships.
works well for monotonic and non-monotonic relationships.
Its effectiveness is evident from the image below.
For all three datasets:
Correlation is low.
PPS (x → y) is high.
PPS (y → x) is zero.
That being said, it is important to note that correlation has its place.
When selecting between PPS and correlation, first set a clear objective about what you wish to learn about the data:
Do you want to know the general monotonic trend between two variables? Correlation will help.
Do you want to know the predictiveness of a feature? PPS will help.
👉 Over to you: What other points will you add here about PPS vs. Correlation?
Get started with PPS: GitHub.
👉 If you liked this post, don’t forget to leave a like ❤️. It helps more people discover this newsletter on Substack and tells me that you appreciate reading these daily insights. The button is located towards the bottom of this email.
Thanks for reading!
Whenever you’re ready, here are a couple of more ways I can help you:
Get the full experience of the Daily Dose of Data Science. Every week, receive two 15-mins data science deep dives that:
Make you fundamentally strong at data science and statistics.
Help you approach data science problems with intuition.
Teach you concepts that are highly overlooked or misinterpreted.
Promote to 32,000 subscribers by sponsoring this newsletter.
👉 Tell the world what makes this newsletter special for you by leaving a review here :)
👉 If you love reading this newsletter, feel free to share it with friends!


Mutual information is another good measure.