
Clustering Evaluation Without Labels
Three techniques, clearly explained.

Free video tutorials to Master LLM evals & observability
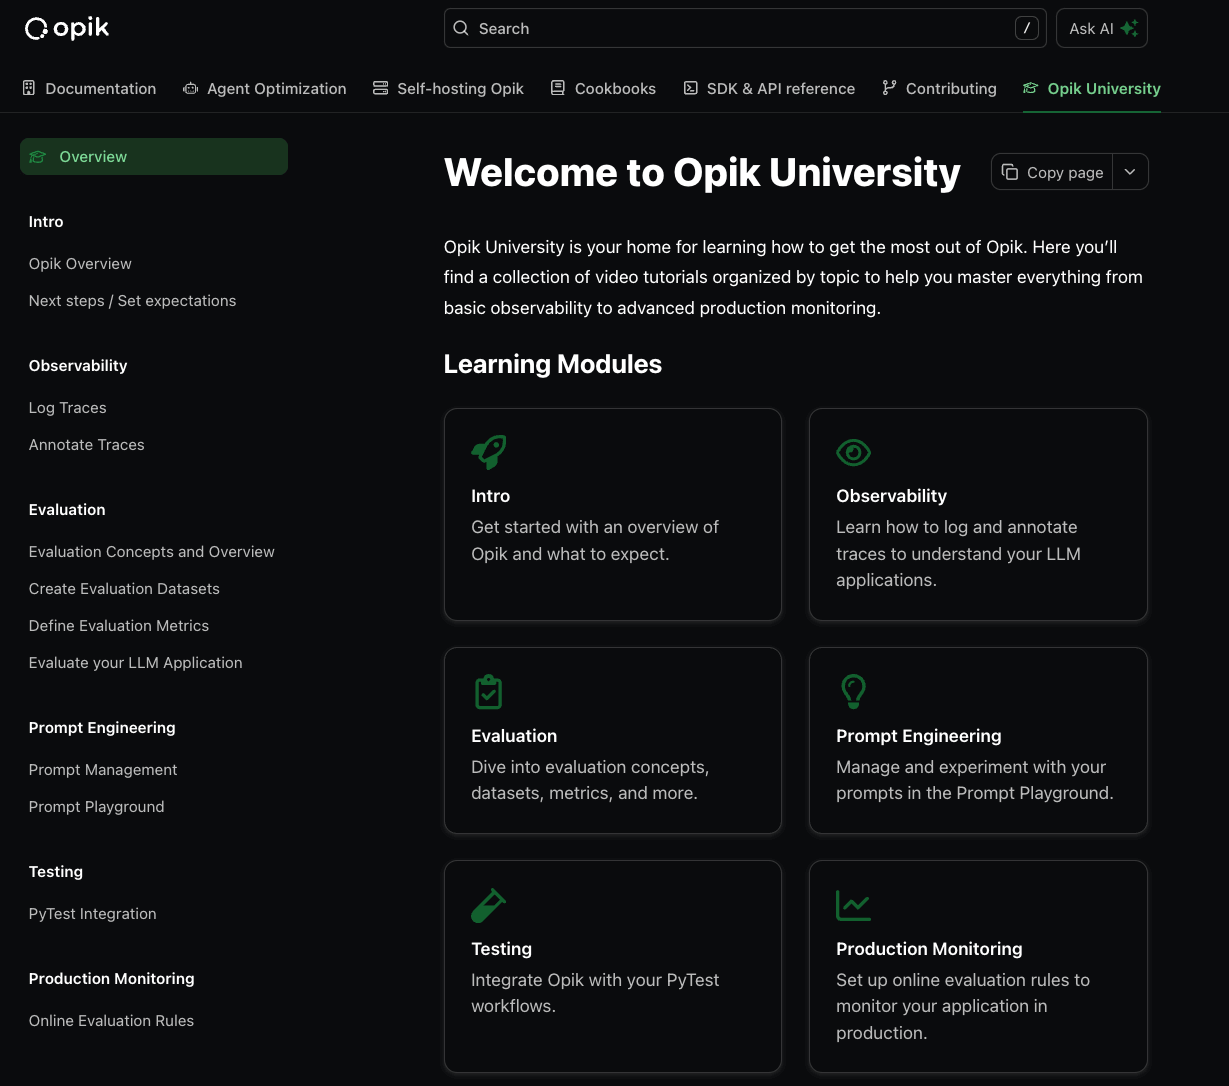
Opik is an open-source platform for evaluating and monitoring LLM apps, and if you're new to LLM monitoring, we found some free learning modules by Opik University that start from the basics to production-ready monitoring.
Here's what it teaches:
Observability: Log and trace your LLM applications
Evaluation: Build datasets and metrics that matter
Prompt engineering: Experiment in the Prompt Playground
Production monitoring: Set up automated evaluation rules
Testing: Integrate with your PyTest workflows
Each module includes hands-on video tutorials for enhanced learning.
You can find them in the documentation here →
Clustering evaluation without labels
Continuing the discussion on evaluation...
Evaluating clustering quality is usually difficult since we have no labels. Thus, we must rely on intrinsic measures to determine clustering quality.
Here are three metrics I commonly use:
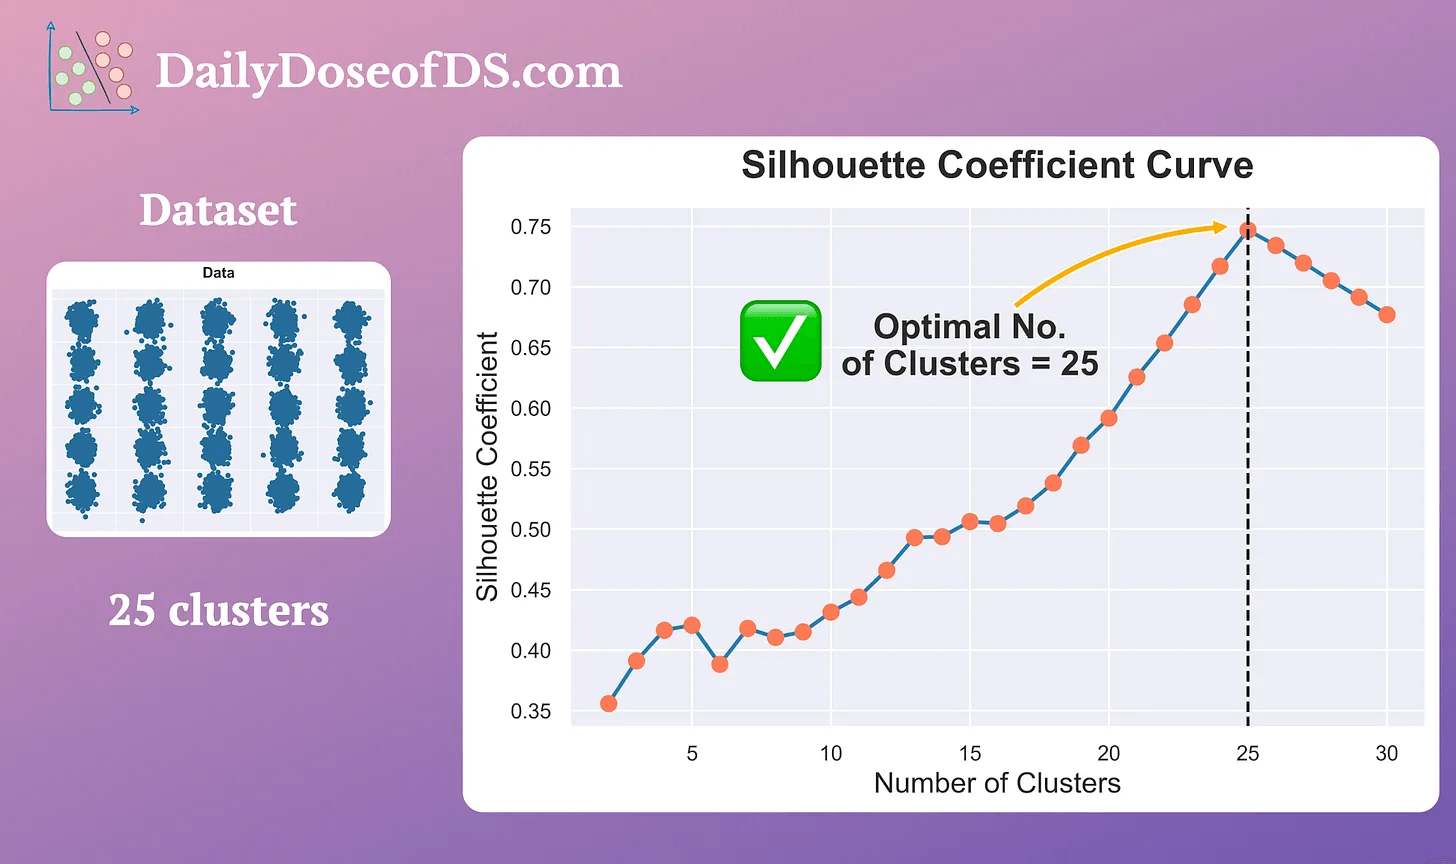
1) Silhouette coefficient:
Here's the core idea:
If the average distance to all data points in the same cluster is small...
...but that to another cluster is large...
...this indicates that the clusters are well separated and somewhat "reliable."

It is measured as follows:
For every data point:
A→ average distance to all other points within its cluster.B→ average distance to all points in the nearest cluster.score
= (B-A)/max(B, A)
Next, compute the average of all scores to get the overall clustering score.
If B is much greater than A, then score=1 and it indicates the clusters are well separated.
Measuring it across a range of centroids (k) can reveal which clustering results are most promising:
2) Calinski-Harabasz Index
The run-time of Silhouette score grows quadratically with total data points.
Calinski-Harabasz Index handles this, while being similar to Silhouette score.

Here’s how it is measured:
A→ sum of squared distance between centroids and the dataset's center.B→ sum of squared distance between all points and their specific centroid.Metric is computed as
A/B(with an additional scaling factor).
If A is much greater than B, then score>>1 and it indicates the clusters are well separated.
Calinski-Harabasz Index makes the same intuitive sense as the Silhouette Coefficient while being much faster to compute.
3) DBCV
Silhouette score and Calinski-Harabasz index are typically higher for globular (spherical in the case of 3D) clusters.
Thus, using them on density-based clustering can produce misleading results.
DBCV (density-based clustering validation) solves this, and it computes two values:
The density within a cluster.
The density overlap between clusters.
A high density within a cluster and a low density overlap between clusters indicate good clustering results. The effectiveness of DBCV is evident from the image below:

As depicted above:
The clustering output of KMeans is worse, but its Silhouette score is still higher than that of Density-based clustering.
With DBCV, the score for the clustering output of KMeans is worse, and that of density-based clustering is higher.
That said, here, we covered centroid-based and density-based evaluation.
You can read about Distributed-based clustering and its evaluation here: Gaussian Mixture Models (GMMs).
Also, you can read about DBSCAN++ here: DBSCAN++: The Faster and Scalable Alternative to DBSCAN Clustering.
👉 Over to you: What are some other ways to evaluate clustering performance in such situations?
Thanks for reading!
P.S. For those wanting to develop “Industry ML” expertise:

At the end of the day, all businesses care about impact. That’s it!
Can you reduce costs?
Drive revenue?
Can you scale ML models?
Predict trends before they happen?
We have discussed several other topics (with implementations) that align with such topics.
Here are some of them:
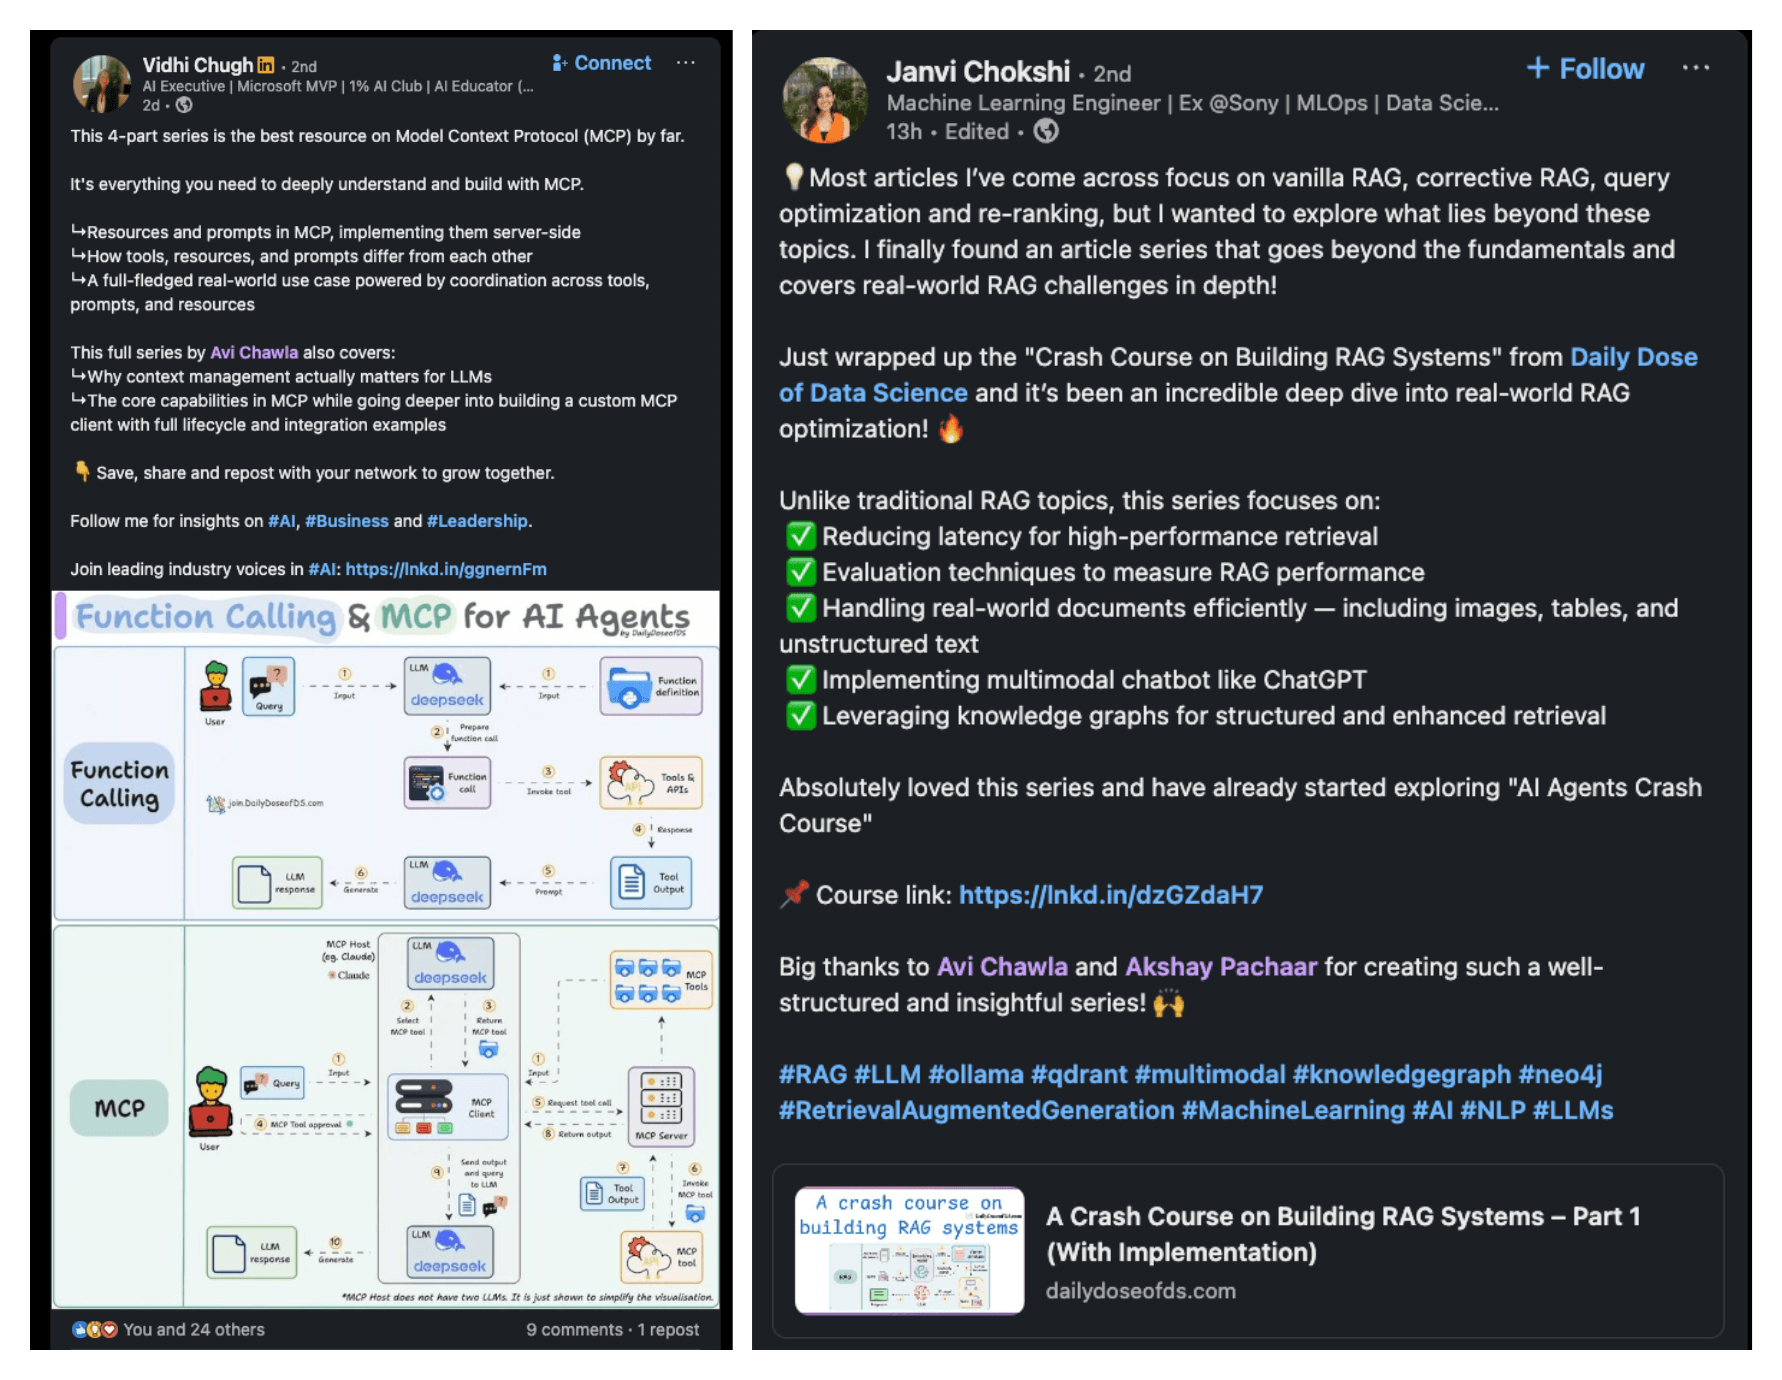
Learn everything about MCPs in this crash course with 9 parts →
Learn how to build Agentic systems in a crash course with 14 parts.
Learn how to build real-world RAG apps and evaluate and scale them in this crash course.
Learn sophisticated graph architectures and how to train them on graph data.
So many real-world NLP systems rely on pairwise context scoring. Learn scalable approaches here.
Learn how to run large models on small devices using Quantization techniques.
Learn how to generate prediction intervals or sets with strong statistical guarantees for increasing trust using Conformal Predictions.
Learn how to identify causal relationships and answer business questions using causal inference in this crash course.
Learn how to scale and implement ML model training in this practical guide.
Learn techniques to reliably test new models in production.
Learn how to build privacy-first ML systems using Federated Learning.
Learn 6 techniques with implementation to compress ML models.
All these resources will help you cultivate key skills that businesses and companies care about the most.