CNN Explainer: An Interactive Tool You Always Wanted to Try to Understand CNNs
CNN Explainer: Interactively Visualize a Convolutional Neural Network.
Convolutional Neural Networks (CNNs) have been a revolutionary deep learning architecture in computer vision.
The core component of a CNN is convolution, which allows it to capture local patterns, such as edges and textures, and helps in extracting relevant information from the input.
Yet, at times, understanding:
how CNNs internally work
how inputs are transformed
what is the representation of the image after each layer
how convolutions are applied
how pooling operation is applied
how the shape of the input changes, etc.
…is indeed difficult.
If you have ever struggled to understand CNN, you should use CNN Explainer.
Note: This is NOT a sponsored post. I genuinely found this tool to be pretty useful for those struggling to understand the internal workings of a CNN.
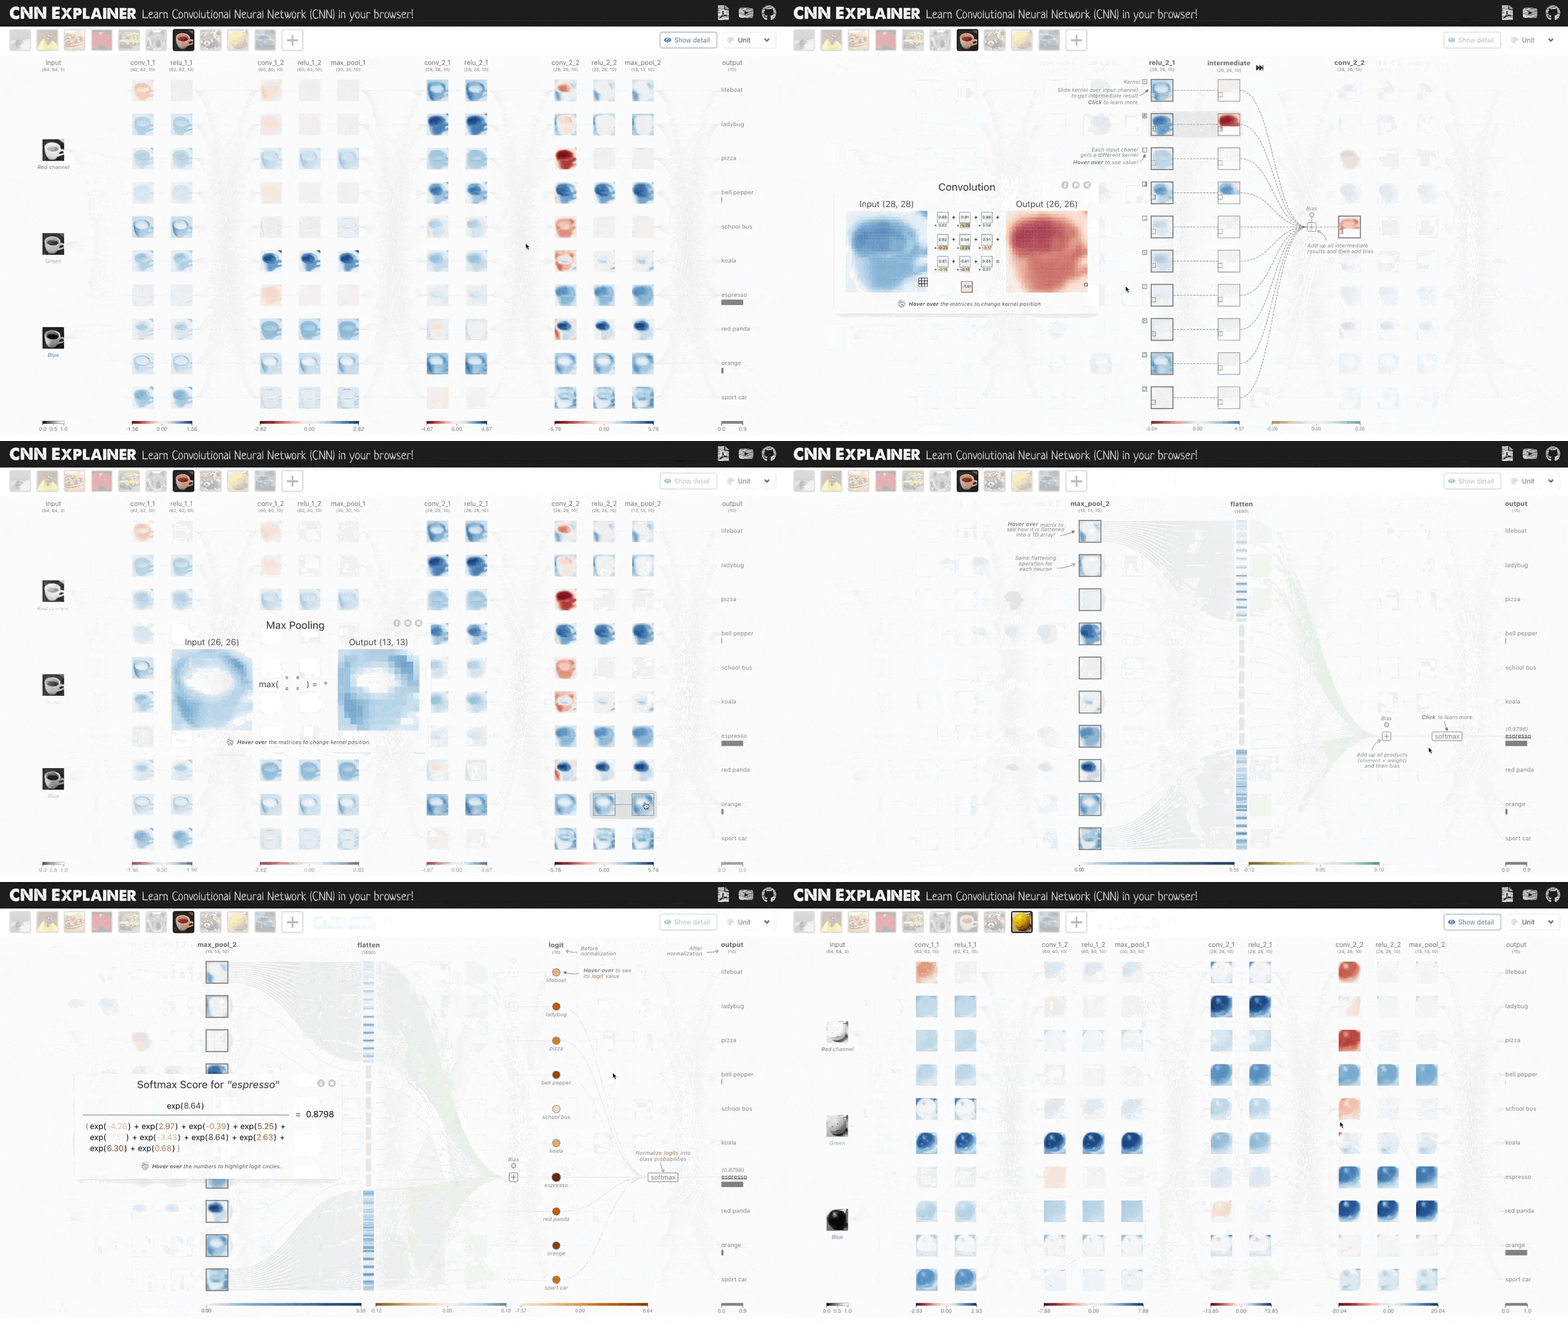
It is an incredible interactive tool to visualize the internal workings of a CNN.
Essentially, you can play around with different layers of a CNN and visualize how a CNN applies different operations.
Clicking on any of the core operations (convolution, max pooling, activation) will make the entire internal workings super clear to you.
Yet, if you find any issues, let me know.
Try it here: CNN Explainer.
👉 Over to you: What are some interactive tools to visualize different machine learning models/architectures, that you are aware of?
👉 If you liked this post, don’t forget to leave a like ❤️. It helps more people discover this newsletter on Substack and tells me that you appreciate reading these daily insights.
The button is located towards the bottom of this email.
Thanks for reading!
Latest full articles
If you’re not a full subscriber, here’s what you missed last month:
DBSCAN++: The Faster and Scalable Alternative to DBSCAN Clustering
Federated Learning: A Critical Step Towards Privacy-Preserving Machine Learning
You Cannot Build Large Data Projects Until You Learn Data Version Control!
Sklearn Models are Not Deployment Friendly! Supercharge Them With Tensor Computations.
Deploy, Version Control, and Manage ML Models Right From Your Jupyter Notebook with Modelbit
Gaussian Mixture Models (GMMs): The Flexible Twin of KMeans.
To receive all full articles and support the Daily Dose of Data Science, consider subscribing:
👉 Tell the world what makes this newsletter special for you by leaving a review here :)
👉 If you love reading this newsletter, feel free to share it with friends!


Congrats for the great work you are doing!!!
In typical images representing CNNs, it seems that the sliding window that scans the input images and feeds a conv layer in the first group of layers, uses the same set of weights in each layer. For example, a 4x4 sliding window requires 16 weights. Assuming 20 layers in the 1st conv group we have 4x4x20=320 weights, right?
Then, in the second group of conv layers it seems that each layer gets input from a volume (3D) of neurons that includes part of every layer of the previous group of layers. Right? What happens with the weights there? Reading 20 layers at the same time with a, say, 3x3 sliding window results in 3x3x20=180 weights. Having, say, 20 layers in the second conv group gives 180x20=3600 weights. Is that right or am I missing something?
For example, in the visualisation, a layer in conv_1_2 gets input from 10 layers of the previous stage. Each layer there is scaned by a 3X3 sliding window, that is, 3X3X10=90 weights. Given that conv_1_2 has 10 layers, we have 90X10=900 trainable parameters between conv_1_1 and conv_1_2. Right?
One of the most informative newsletter I have ever subscribed to.
Thanks Avi !