Covariate Shift Is Way More Problematic Than Most People Think
Here's what most people overlook when detecting covariate shift.
Almost all real-world ML models gradually degrade in performance due to covariate shift.
For starters, covariate shift happens when the distribution of features changes over time, but the true (natural) relationship between input and output remains the same. We have already discussed it in detail before.
It is a serious problem because we trained the model on one distribution, but it is being used to predict on another distribution in production.
Thus, it is critical to detect covariate shift early so that models continue to work well.
One of the most common and intuitive ways to detect covariate shift is by simply comparing the feature distribution in training data to that in production.
This could be done in many ways, such as:
Compare their summary statistics — mean, median, etc.
Inspect visually using distribution plots.
Perform hypothesis testing.
Measure distances between training/production distributions using Bhattacharyya distance, KS test, etc.
While these approaches are often effective, the biggest problem is that they work on a single feature at a time.
But, in real life, we may observe multivariate covariate shift as well.
Multivariate covariate shift happens when:
The distribution of individual distributions remains the same:
P(X1) and P(X2) individually remain the same.
But their joint distribution changes:
P(X1, X2) changes.
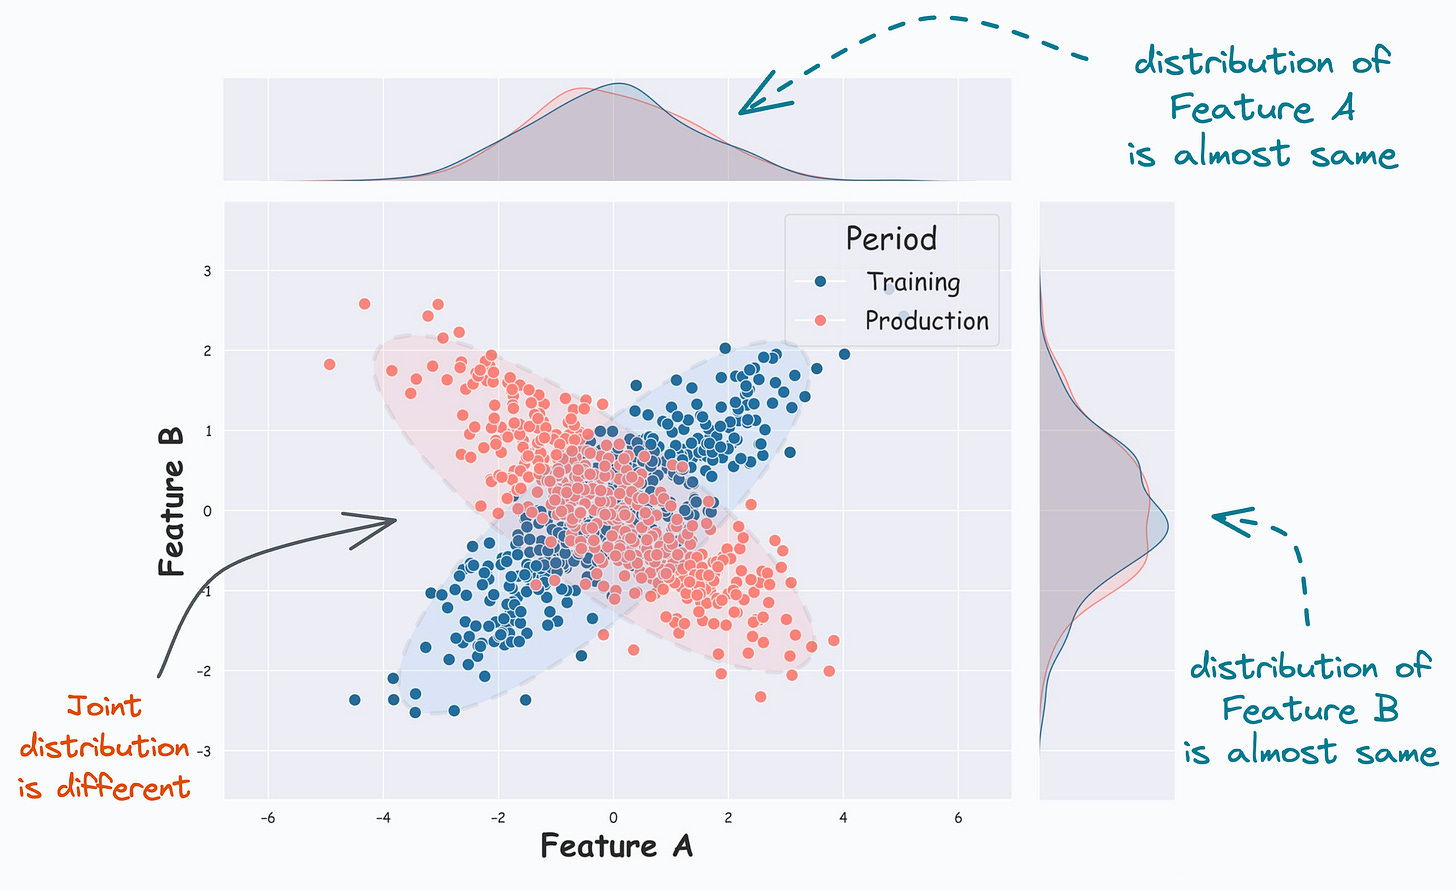
This is evident from the image below:
From the KDE plots on the top and the right, it is clear that the distribution of both features (covariates) is almost the same.
But, the scatter plot reveals that their joint distribution in training (Blue) differs from that in production (Red).
And it is easy to guess that the univariate covariate shift detection methods discussed above will produce misleading results.
For instance, as demonstrated below, measuring the Bhattacharyya distance between a training and production feature gives a very low distance value, indicating high similarity:
In fact, even though the individual feature distribution is the same, we can confirm experimentally that this will result in a drop in model performance:
Let’s say the true output y = 2*Feature_A + 3*Feature_B + noise.
In most cases, the true output predictions on production data are not immediately available. In the above demonstration, just assume that we have already gathered the true predictions somehow.
As depicted above, the model performance drops by 20% in production, which is huge.
Here, we may completely rule out the possibility of covariate shift if we think that covariate shift can never be multivariate in nature.
Of course, in the figure below, it was easy to identify multivariate covariate shift because we are only looking at two features.
But multivariate covariate shift can happen with more than two features as well.
Unlike the bivariate case above, visual inspection will not be possible for higher dimensions.
Now you know the problem.
So how can we detect this?
Today, instead of proposing the solution myself, I want you to give this problem a thought.
More specifically, you have to think about:
How can we reliably detect multivariate covariate shift?
We will continue the discussion tomorrow, but in the meantime, I would love to hear from you :)
Multivariate covariate shift is a common problem that many real-world ML models suffer from.
Thus, it is critical to detect covariate shift early so that models continue to work as expected.
I am eagerly waiting to hear from you.
Thanks for reading!
👉 If you liked this post, don’t forget to leave a like ❤️. It helps more people discover this newsletter on Substack and tells me that you appreciate reading these daily insights. The button is located towards the bottom of this email.
Latest full articles
If you’re not a full subscriber, here’s what you missed last month:
You Cannot Build Large Data Projects Until You Learn Data Version Control!
Why Bagging is So Ridiculously Effective At Variance Reduction?
Sklearn Models are Not Deployment Friendly! Supercharge Them With Tensor Computations.
Deploy, Version Control, and Manage ML Models Right From Your Jupyter Notebook with Modelbit
Model Compression: A Critical Step Towards Efficient Machine Learning.
Gaussian Mixture Models (GMMs): The Flexible Twin of KMeans.
To receive all full articles and support the Daily Dose of Data Science, consider subscribing:
👉 Tell the world what makes this newsletter special for you by leaving a review here :)
👉 If you love reading this newsletter, feel free to share it with friends!


If dataset 1 is stored in the matrix X (rows = observations, columns = variables) and dataset 2 is stored in Y, we could calculate X^T*X and Y^T*Y, which removes the difference in sample size and is independent of the orders of the rows. Then we could calculate the Frobenius distance between them, ||X^T*X - Y^T*Y||_F. Not sure if it means anything though, just a thought.
Hi Avi Chawla, Hi Everyone!
This is an important topic which i face a lot of time on my daily work. For me, my big question is: how to use previous data and model to adapt for this covariate shift?
In a regression (or classification) framework, most time the new data is arriving which is different for the one used to built the model, but we do not have targets/labels for this new data. Thus, (re)train a (new) model on the new data is not feasible. Which adaptation we can follow to deal with this question?
Thank you,