
Create a Moving Bubbles Chart in Python
...in just three lines of code.

I often come across the moving bubbles chart on LinkedIn.
I am sure you would have seen them too.
It is an elegant animation that depicts the movements of entities across time. They are particularly useful for determining when clusters appear in the data and at what state(s).
I always wondered how one can create them in Python.
Turns out, there’s a pretty simple way to do it just three lines of Python using D3Blocks.
The library utilizes the graphics of the popular d3js Javascript library to create visually appealing charts with only a few lines of Python code.
To create a moving bubbles chart, you can use the d3.movingbubbles() method.
The input should be a Pandas DataFrame. Each row should represent the state of a sample at a particular timestamp, as depicted below:
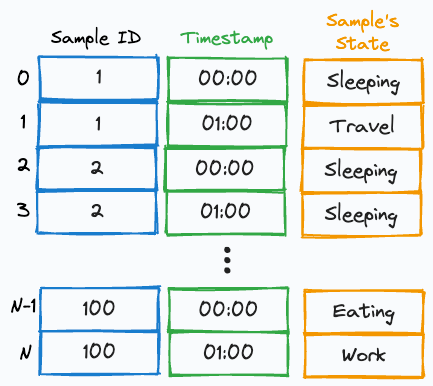
After aligning the DataFrame in the desired format, you can create the moving bubbles chart as follows:

This will create an HTML file. You can preview it in a browser or open it in Jupyter directly using the IPython library.
I prepared this Jupyter notebook for you to get started: Moving Bubbles notebook.
That said, the utility of D3Blocks is not just limited to the Moving Bubbles Chart. One can do so much with it, as depicted below, with interactivity:

Why D3blocks when we already have Matplotlib, Plotly, Seaborn, etc.?
The issue with traditional frameworks is that they lose interactivity outside Python. In other words, you always need a Python-backed engine to maintain that interactivity.
With D3blocks, one can create highly customizable plots, which can be integrated with the web.
As a result, with D3blocks, one can create the chart in Python first. Next, they only need a browser to plot the graphs (interactively).
Isn’t that cool?
This Medium article by the creator of D3blocks, Erdogan Taskesen, is fantastic if you want to learn more: D3Blocks: The Python Library to Create Interactive and Standalone D3js Charts.
👉 Over to you: What other charts do you love creating in Python?
Thanks for reading!
Are you preparing for ML/DS interviews or want to upskill at your current job?
Every week, I publish in-depth ML dives. The topics align with the practical skills that typical ML/DS roles demand.
Join below to unlock all full articles:
Here are some of the top articles:
[FREE] A Beginner-friendly and Comprehensive Deep Dive on Vector Databases.
8 Fatal (Yet Non-obvious) Pitfalls and Cautionary Measures in Data Science.
5 Must-Know Ways to Test ML Models in Production (Implementation Included).
A Detailed and Beginner-Friendly Introduction to PyTorch Lightning: The Supercharged PyTorch
Don’t Stop at Pandas and Sklearn! Get Started with Spark DataFrames and Big Data ML using PySpark.
Federated Learning: A Critical Step Towards Privacy-Preserving Machine Learning.
You Cannot Build Large Data Projects Until You Learn Data Version Control!
Sklearn Models are Not Deployment Friendly! Supercharge Them With Tensor Computations.
Join below to unlock all full articles:
👉 If you love reading this newsletter, share it with friends!
👉 Tell the world what makes this newsletter special for you by leaving a review here :)
https://open.substack.com/pub/mkhanshahani/p/the-most-effective-method-to-be-more?r=4q2315&utm_campaign=post&utm_medium=web&showWelcomeOnShare=true
https://open.substack.com/pub/mkhanshahani/p/the-most-effective-method-to-be-more?r=4q2315&utm_campaign=post&utm_medium=web&showWelcomeOnShare=true