

Tracing what happens inside an LLM pipeline
An LLM request rarely maps to one model call once retrieval and tools enter the pipeline.
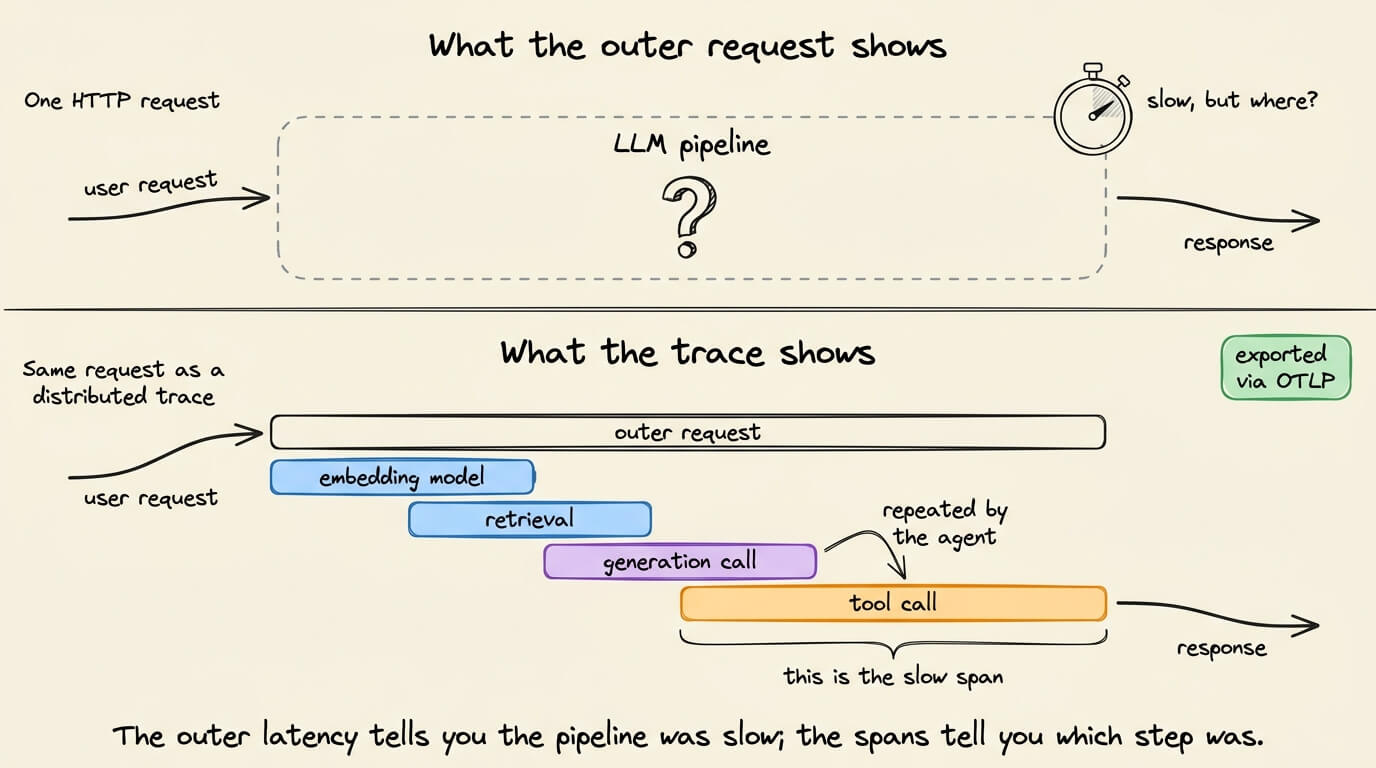
A slow response could come from the embedding model, retrieval step, generation call, or an agent repeating the same tool. Measuring the latency of the outer HTTP request only tells you that the pipeline was slow.
Dynatrace has published a runnable reference application for inspecting the operations inside it.
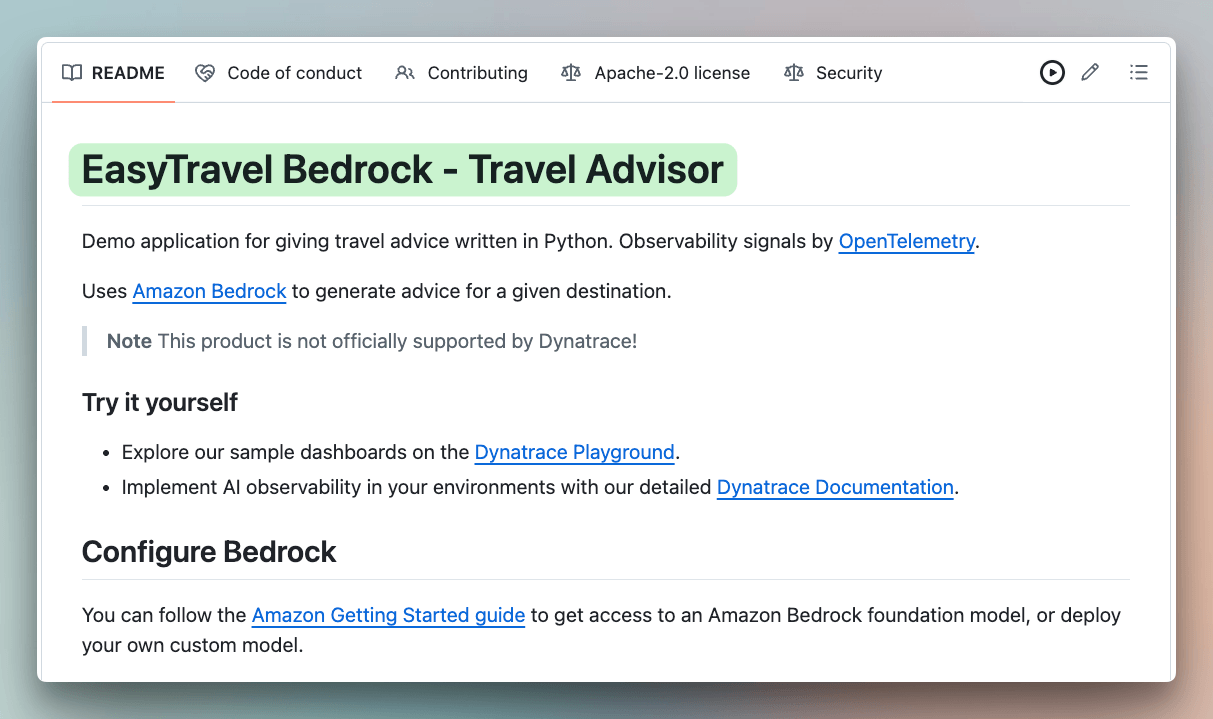
The repository contains a Python travel advisor with basic, RAG, and agentic execution paths. It uses Amazon Bedrock for generation and embeddings, while OpenTelemetry and Traceloop record the application workflow and export its traces to Dynatrace through OTLP.
This lets you inspect the completion request as a distributed trace instead of treating the LLM pipeline as one opaque API call. The repository also includes sample dashboards and deployment files for running the application locally or on a small Kubernetes cluster.
It is a useful reference for instrumenting an LLM application before debugging it under real traffic.
(don’t forget to star 🌟)
Thanks to Dynatrace for partnering today!
Easiest way to run agent harnesses using local models
Local LLMs turn model selection into a resource allocation problem surprisingly quickly.
In practice, the model weights are only one part of the memory budget.
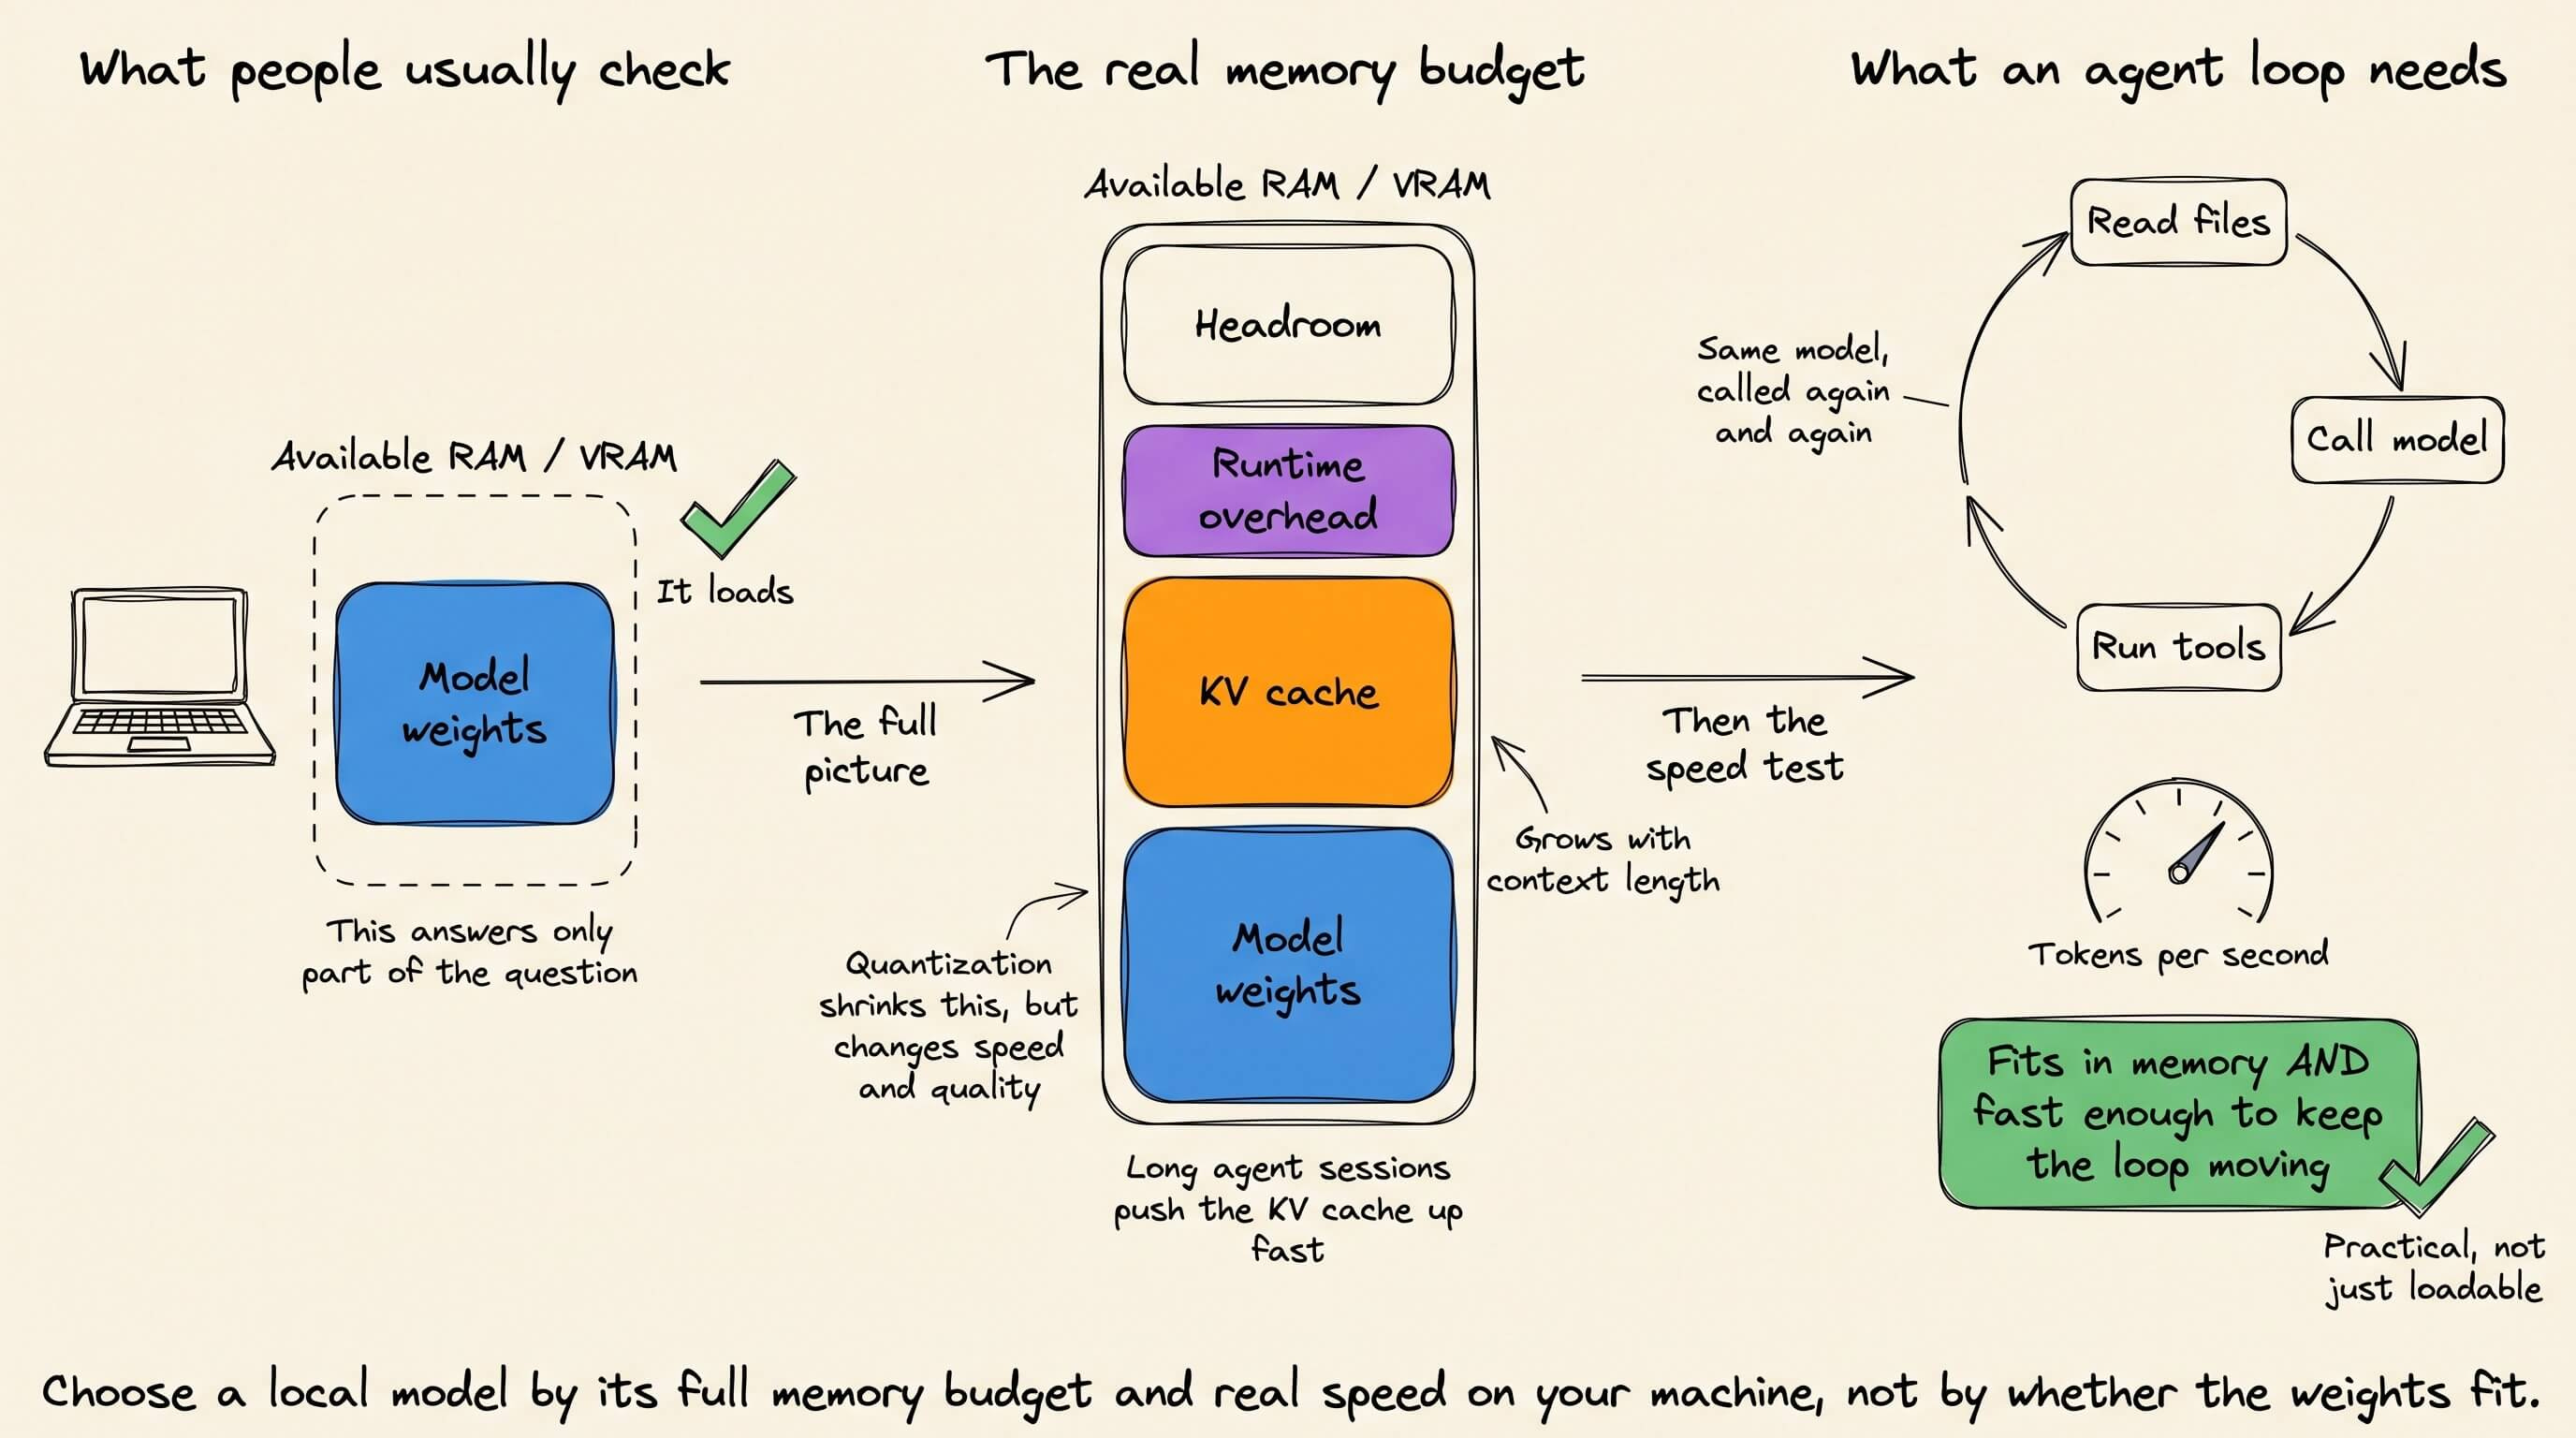
Context length changes KV-cache usage.
Quantization changes both memory and throughput.
Available RAM or VRAM does not tell much about whether inference will actually be fast enough for an agent loop.
And agent harnesses tend to generate long, repeated inference workloads rather than isolated prompts.
That makes “what model can my laptop run?” a harder question than it sounds.
A reliable and simple solution is actually implemented in Magnitude (open-source).
npm i -g @magnitudedev/cli
magnitude setup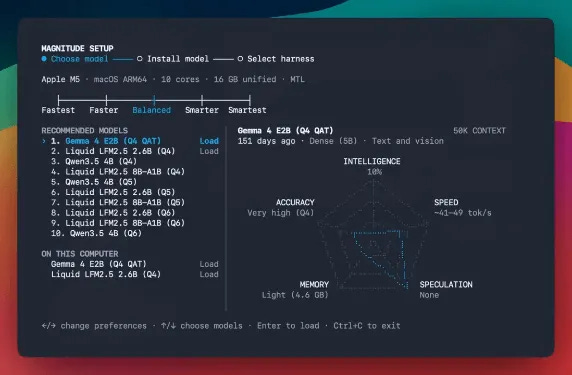
It profiles the machine, benchmarks the hardware, estimates which models are practical rather than merely loadable, and recommends a set of candidates before connecting one to Claude Code, Codex, OpenCode, Pi, etc.
Once done, the actual harness setup becomes quite easy.
You can run two commands, pick the recommendation, and connect the harness.
We recoded this video that walks through the entire flow from machine profiling to a working local coding agent.
Chapters:
00:00 → Intro
00:17 → What Magnitude is
00:45 → Setup in two commands
01:29 → Why local model selection gets complicated
02:11 → Hardware profiling + model recommendations
02:59 → Choosing a harness
03:22 → Connecting an existing harness
Find the repo here → http://github.com/magnitudedev/magnitude
(don’t forget to star it ⭐️)
Good day!