

Anthropic did something you’ll regret ignoring:
They split one coding task across four agents by role, as a planner, implementer, tester, and reviewer.
The goal was to test whether splitting agents by job title is a good way to divide the work.
And they found agents spent more tokens on coordination than on the work itself.
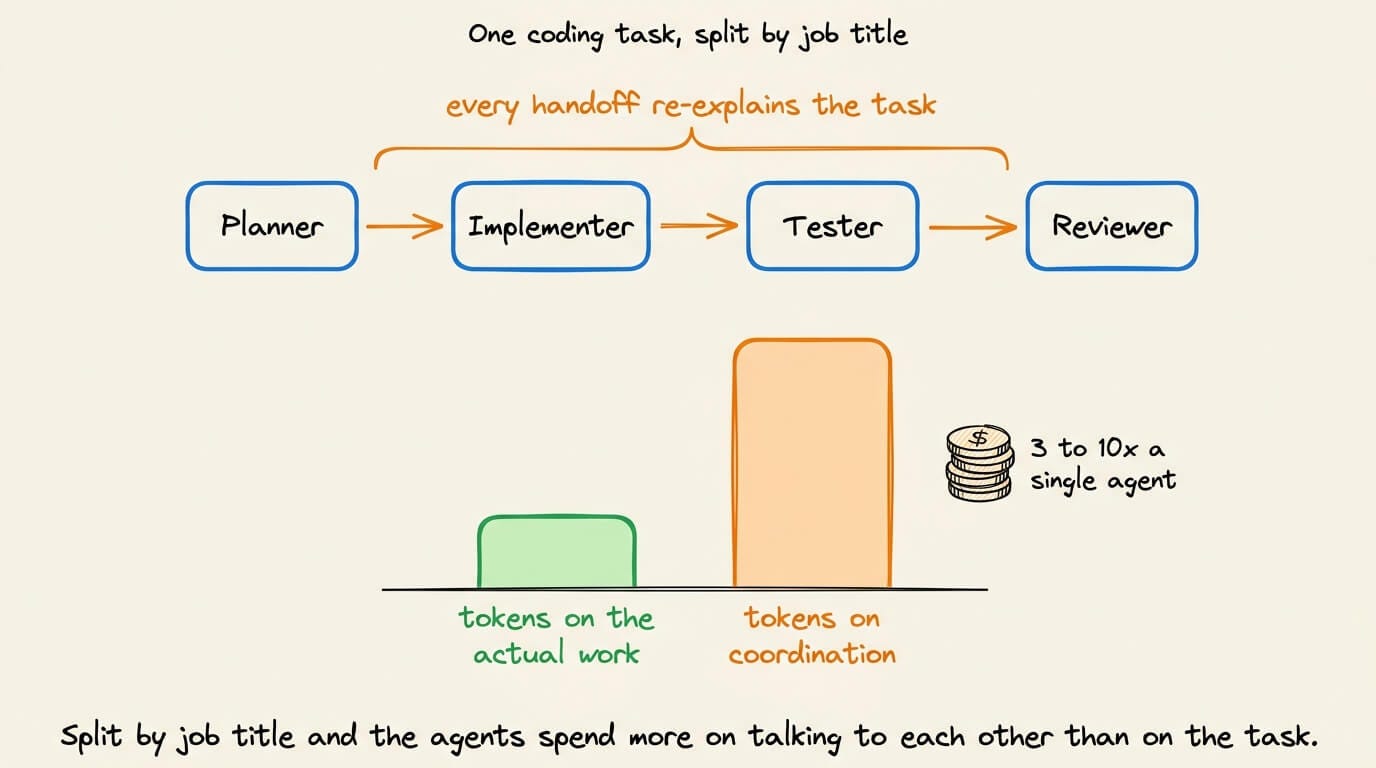
They call it the telephone game, where each handoff degrades what the next agent receives.
OpenAI and Google also built machinery for this rather than leaving it to the prompt.
OpenAI added a “handoffs” primitive to the Agents SDK
Google’s ADK controls how much parent context reaches a sub-agent.
Both are design-time wiring. You declare which agents are reachable from which, and both ends run inside the same framework.
This setup assumes you know which agent feeds which before the run starts, but plenty of agent work isn’t known in advance.
Switch, from Flint AI, is built for that case. It puts agents and people in the same chat channel, so any two of them can work together without being wired to each other in advance.
Say the error rate on a checkout service rises. An on-call agent queries the logs and finds the deploy behind it. Reading that, someone decides the next step is a chart against last week’s baseline.
That decision did not exist a minute ago, so no handoff would have been declared for it. The charting agent is a separate session with an empty context window, often a different framework on a different machine.
So the person makes the routing call and then moves the payload too, by reading the first agent’s answer and typing a version of it into the second.
This creates three problems:
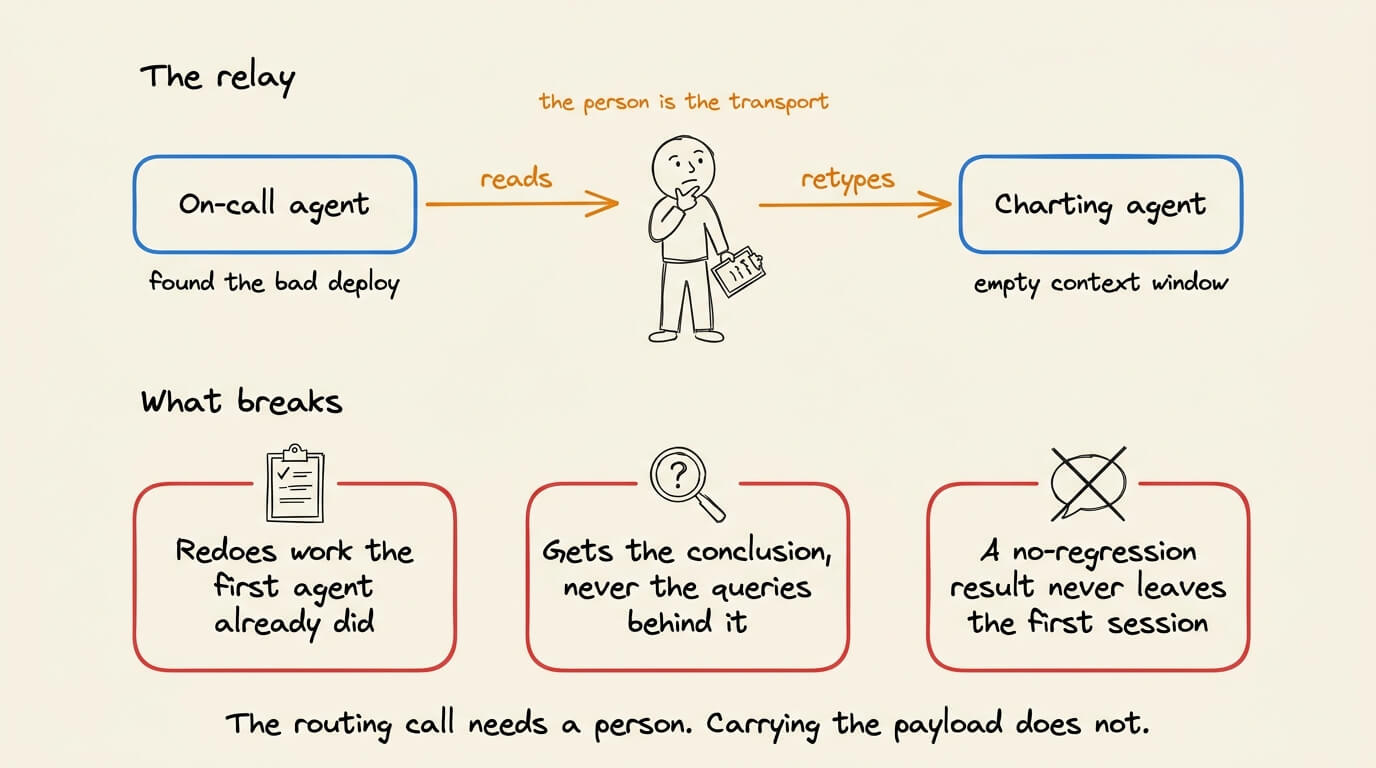
1) The charting agent has no record of the earlier session, so on the next incident it recomputes work the first agent already did.
2) The charting agent only sees the conclusion without the queries behind it, so it either trusts the summary or reruns the retrieval itself.
3) When the first agent finds no regression, nobody types that anywhere, and the rest of the team never learns it was checked.
With Switch, since everyone is working in a shared channel, the person still decides what runs next, but they stop carrying the payload.
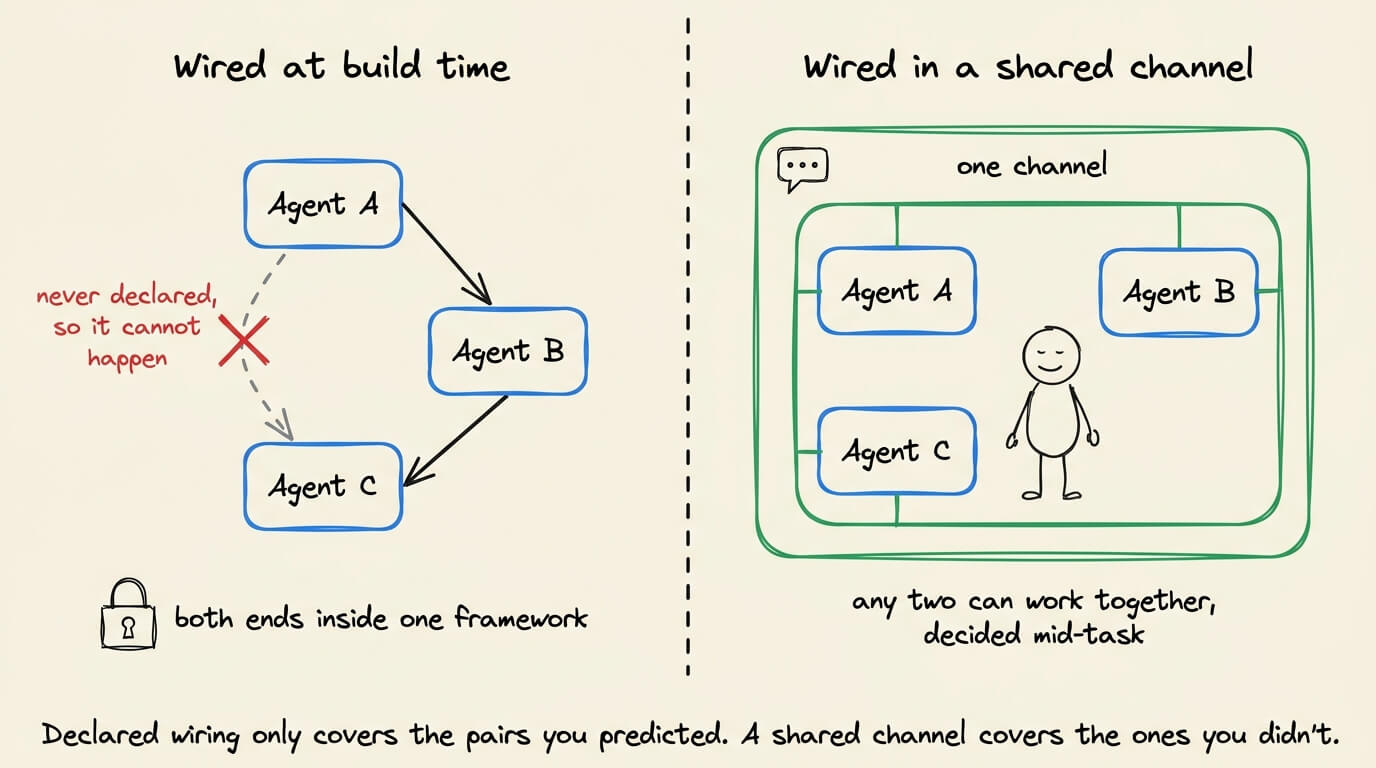
The charting agent joins a channel that already holds the first agent’s report, so it points at that report directly instead of rerunning the queries, and the next incident starts from a channel that shows the earlier one.
The team reads the same thread the agents do, so a no-regression result is visible the moment the first agent posts it.
Switch connects agents built with Claude Code, OpenAI Codex, OpenCode, or any HTTP/MCP-compatible framework directly to the tools your team already uses, like Slack, Teams, Discord, Telegram, and Mattermost.
Thanks to Flint AI for partnering today!
[Hands-on] Turn scientific figures into structured data with Mistral OCR
Scientific papers often hide their most important findings inside figures rather than paragraphs.
Reading those figures manually takes researchers around 36 minutes per paper. An AI-assisted workflow can reduce that to 26.6 seconds.
For a systematic review covering 200 papers, that’s roughly two weeks versus one afternoon.
The bottleneck isn’t that charts are difficult to read. Most document AI never actually looks at them. It reads the surrounding text instead.
So we built an agentic workflow using Mistral OCR 4 that reads every chart in a scientific paper and returns structured data for each figure.
We tested it on biotech, where scientific papers are especially figure-heavy, but the same architecture works across other scientific domains and even fields like finance.
Here’s the complete system running end-to-end 👇
Before building it, though, it’s worth understanding why existing PDF pipelines miss so much information in the first place.
Let’s begin!
Why PDF parsers miss scientific figures
Imagine running a standard PDF parser on a 12-page medical research paper.
It extracts around 8,000 words of clean text and saves 11 figures as image references. The body text says, “As shown in Figure 3, treatment group B demonstrated significantly improved outcomes.”
If you open Figure 3, you’ll find a chart comparing how three treatment groups perform over time. It contains the actual measurements, trends, and statistical results that support the paper’s conclusion.
The parser saves that chart as a PNG, but the numbers are gone.
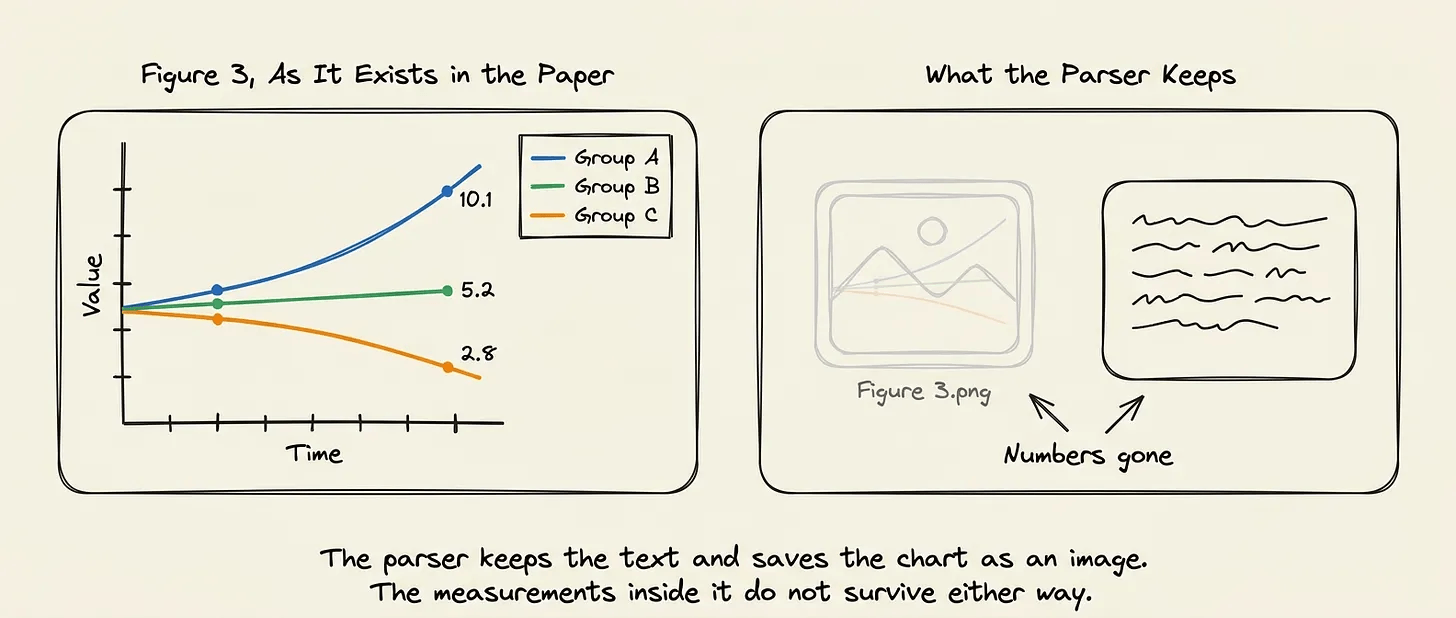
And this isn’t unique to medical research. The same thing happens anywhere the important information is contained within a figure rather than in the surrounding text, such as scientific bar charts, line charts, scatter plots, graphs, financial reports, etc.
Standard PDF parsers aren’t fully broken. They’re doing exactly what they were built to do, which is extract the text layer.
The problem is that many important findings never exist as text in the first place. It also combines tables, charts, diagrams, and images into one.
What good document intelligence requires
Reading a research paper involves several different tasks, all happening at once.
Some information is written as text. Some lives are inside charts and diagrams. And turning all of that into structured data is another task entirely.
Trying to solve everything in one pass usually mixes those jobs together. A more reliable approach is to keep them separate.
Here, two separations matter more than anything else.
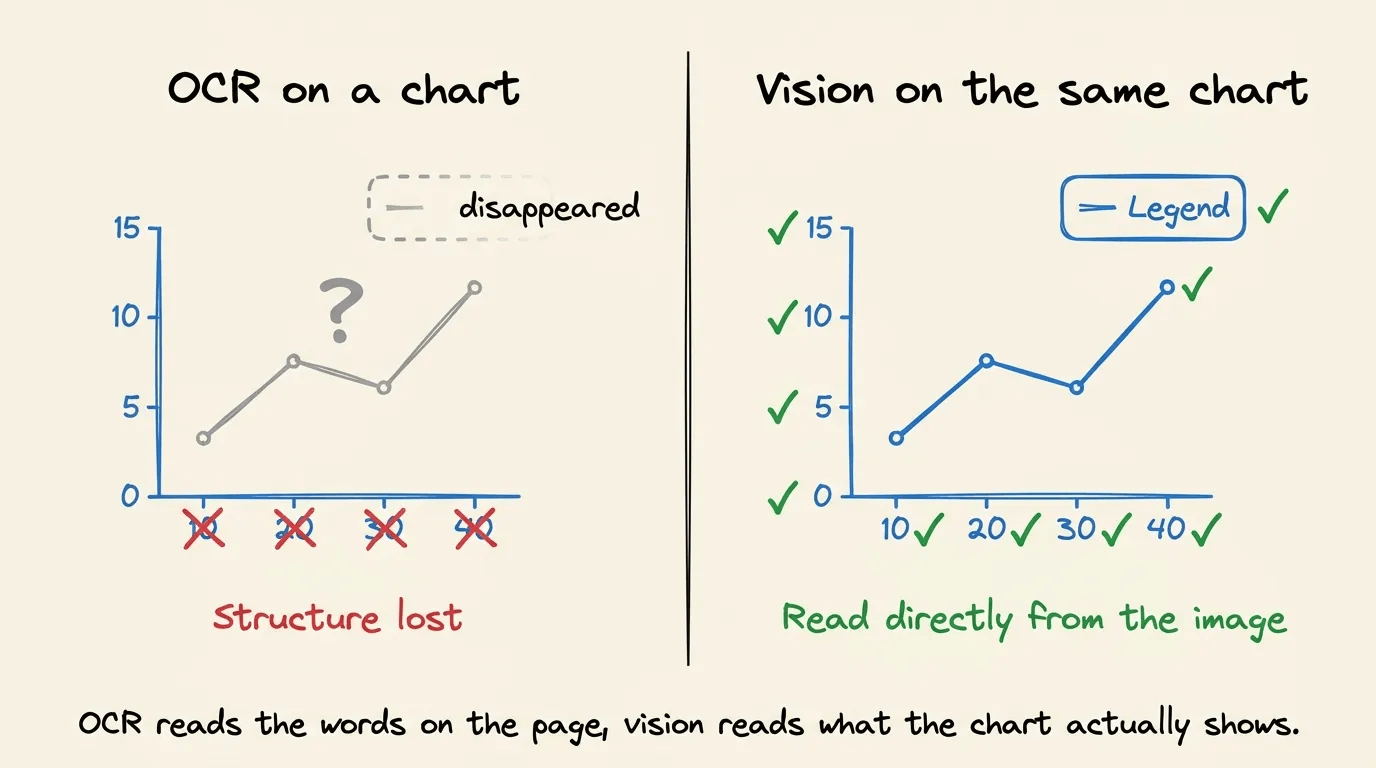
OCR reads text, and Vision reads charts
OCR is excellent at recovering written text from a page. But a chart isn’t just text.
Axis values, legends, data points, colors, and relationships between them all carry meaning that OCR was never designed to understand.
Dense tick labels get misread, small legends disappear, and the structure of the chart is lost.
The analysis step needs to look at the image itself, not just the text around it.
Keeping extraction and analysis separate
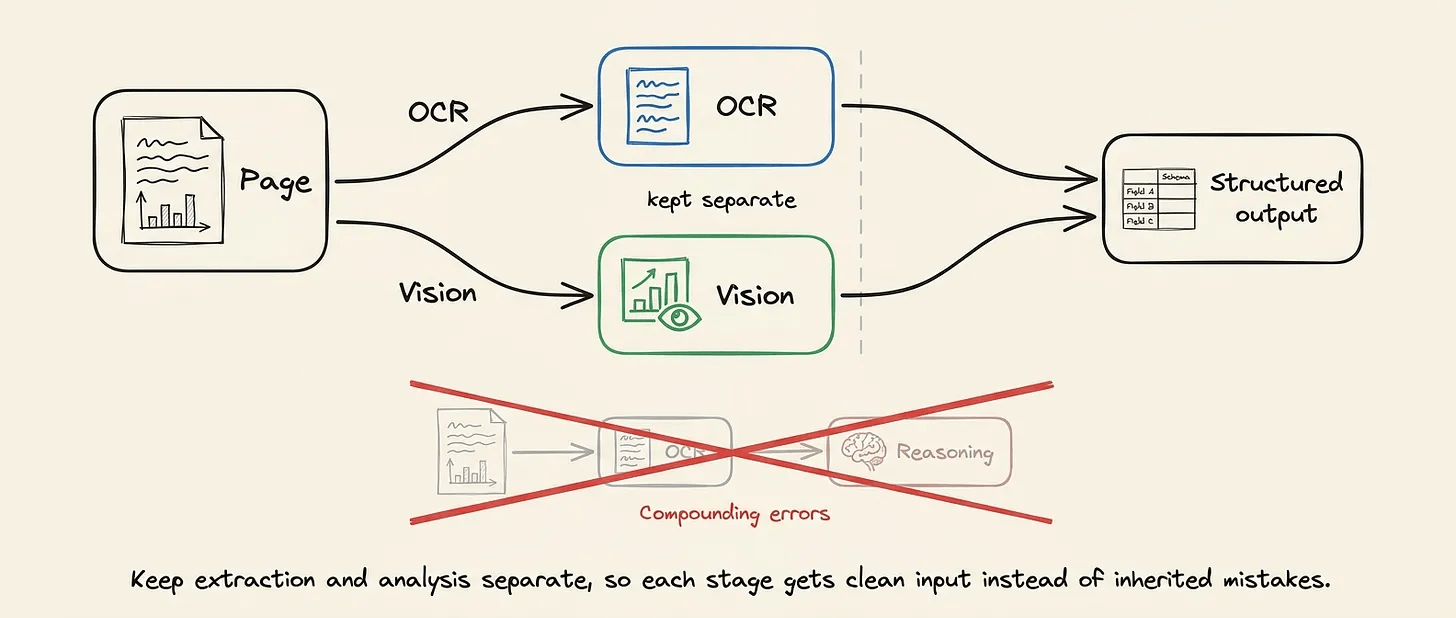
Once the chart has been isolated, interpreting it is a different problem from extracting it.
If OCR errors flow directly into the reasoning step, those mistakes compound throughout the pipeline.
Separating extraction from analysis means each stage receives a clean, well-defined input instead of inheriting every mistake made before it.
Everything else follows naturally: (a) a chart-aware extraction, (b) a consistent schema for every figure, and (c) a structured output.
All can be indexed, searched, or stored in a vector database without additional cleanup.
Using Mistral OCRv4 for extraction
Earlier, we saw that standard PDF parsers miss much of what makes scientific figures valuable.
Part of the reason is how they read a page in the first place:
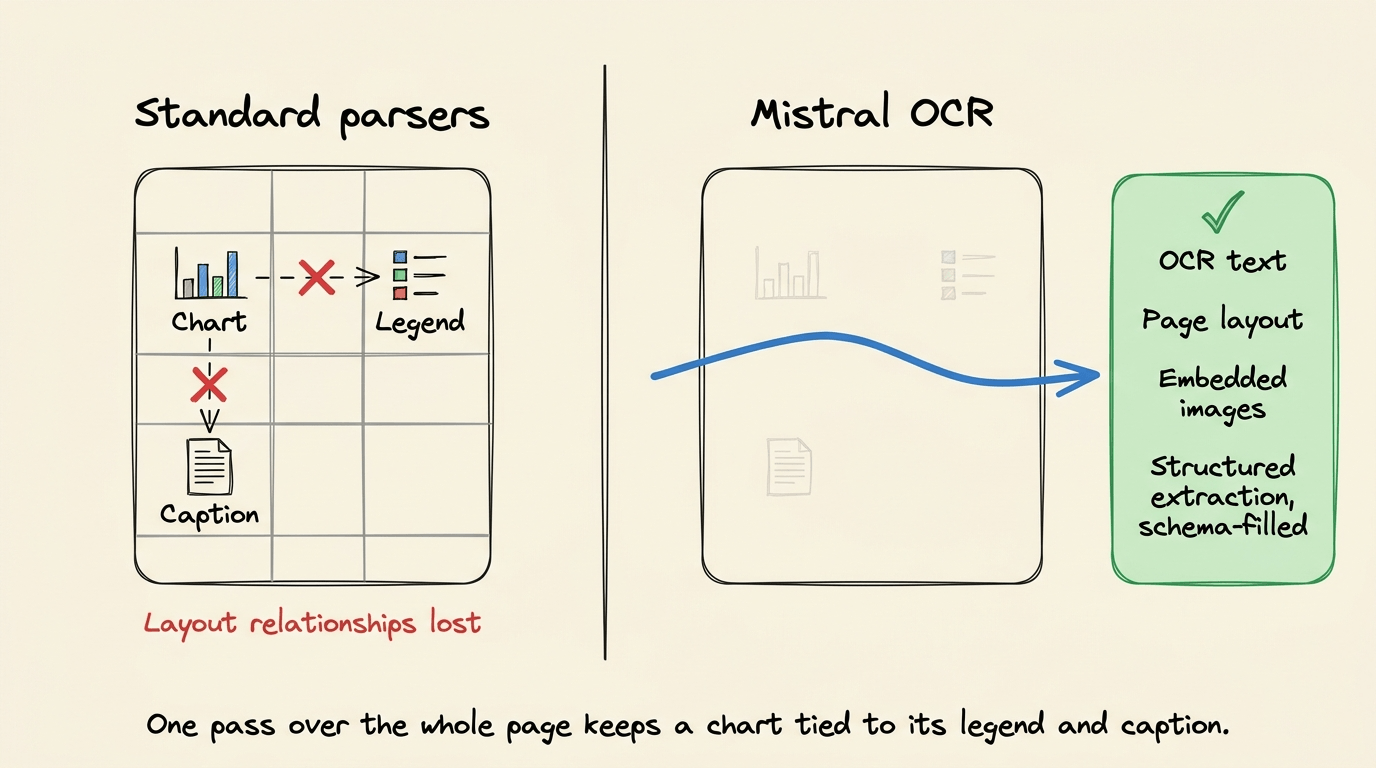
Most parsers break a page into small blocks and process each one independently before stitching the results back together. That works well for ordinary documents, but scientific papers depend heavily on layout.
A legend in the corner gets separated from the chart it belongs to. A caption loses its connection to the figure it describes. The extraction still succeeds, but the document’s meaning does not.
Mistral OCR takes a different approach:
Instead of processing isolated blocks, it performs a Document AI pass over the entire page, understanding both the layout and the content together.
A single request returns the OCR text, page layout, embedded figure images, and structured extractions.
When you provide a JSON schema, the model fills that schema directly instead of returning free-form text.
For documents filled with dense axis labels, tiny legends, and complex layouts, that whole-page understanding keeps figures connected to the information around them.
Later, that becomes the foundation for everything else in this pipeline.
Everything from one request
Everything in the extraction stage comes from a single OCR request. So it’s actually one API call that returns:
page text
page layout
every embedded figure
and structured figure metadata
import os
from mistralai.client import Mistral

api_key = os.environ["MISTRAL_API_KEY"]

ocr_response = client.ocr.process(
    model="mistral-ocr-4-0",
    document={
        "type": "file",
        "document_url": uploaded.id
    },
    include_image_base64=True,
    include_blocks=True,
    confidence_scores_granularity="page",
)
The request asks Mistral OCRv4 to return both the extracted document and the embedded figures in the same response, while preserving enough layout information for later matching.
Note: The code above pins
mistral-ocr-4-0, the version this workflow was built on. Mistral has since shipped OCR 4.1, a model update that keeps every capability used here and reads busy, marked-up pages more precisely. Bounding boxes align to each element instead of drifting, callouts on dense technical diagrams stay as separate regions instead of merging into one, and multi-column pages return each column on its own rather than collapsing them together. Themistral-ocr-latestalias now points to 4.1, so moving this pipeline over is a change to the model string and nothing else.
The practical benefit here is that there is no second extraction pass, no intermediate conversion step, and no additional state to manage between stages.
Rather than letting the model invent its own response structure, the pipeline defines exactly what every extracted figure should contain.
The document_annotation_format argument is the schema argument.
_FIGURE_SCHEMA = {
    "type": "object",
    "properties": {
        "figures": {
            "type": "array",
            "description": "...",
            "items": {
                "type": "object",
                "properties": {
                    "figure_id": {"type": "string", "description": "..."},
                    "page_number": {"type": "integer", "description": "..."},
                    "chart_type": {"type": "string", "description": "..."},
                    "title": {"type": "string", "description": "..."},
                    "x_axis": {"type": "string", "description": "..."},
                    "y_axis": {"type": "string", "description": "..."},
                    "data_summary": {"type": "string", "description": "..."},
                    "conditions": {"type": "array", "items": {"type": "string"}, "description": "..."},
                    "caption": {"type": "string", "description": "..."},
                },
            },
        }
    },
}

_DOCUMENT_ANNOTATION_FORMAT = {
    "type": "json_schema",
    "json_schema": {
        "name": "figures",
        "schema_definition": _FIGURE_SCHEMA,
        "strict": False,
    },
}
Each figure is returned with structured fields such as its title, caption, chart type, axis labels, experimental conditions, and a summary of the visible data.
Here’s what that looks like for a single figure:
{
  "figures": [
    {
      "figure_id": "Figure 3",
      "page_number": 4,
      "chart_type": "line",
      "title": "Change in body weight over 68 weeks",
      "x_axis": "Time (weeks)",
      "y_axis": "Mean percent change in body weight (%)",
      "data_summary": "Semaglutide group shows a steady decline reaching approximately -14.9% at week 68, while the placebo group plateaus near -2.4%.",
      "conditions": ["Semaglutide 2.4 mg", "Placebo"],
      "caption": "Figure 3. Mean percent change in body weight from baseline to week 68 in the semaglutide and placebo groups."
    }
  ]
}
Explore more in the Mistral OCRv4 docs →
Matching figures to their images
The OCR response already contains both structured figure information and the embedded images. What it doesn’t include is a direct link between them.
The pipeline creates that link itself.
It breaks the extracted caption into words and compares those against the OCR text, looking for the strongest overlap.
Once a figure is matched to its page, the next unused image on that page is assigned to it.
A small cursor ensures that when multiple figures appear on the same page, each one receives its own image instead of a repetitive selection.
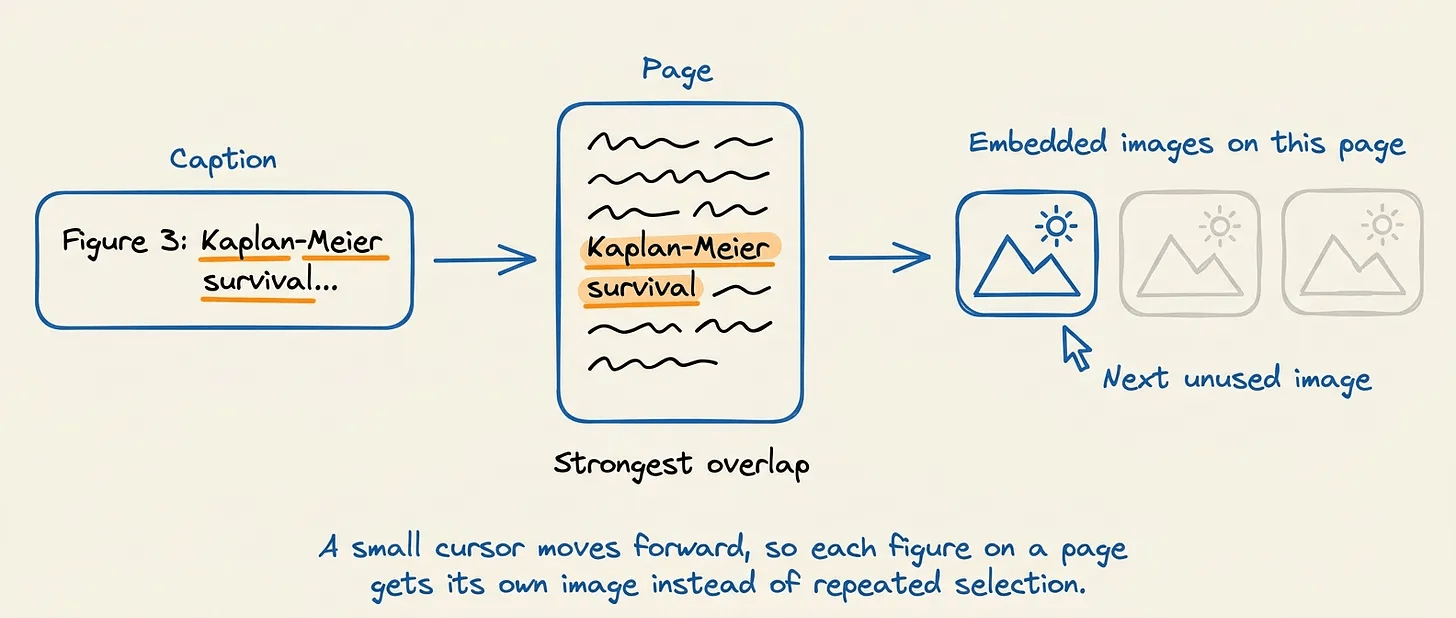
If a caption is too short or ambiguous to match confidently, the pipeline falls back to the page number reported by Mistral OCRv4.
By the end of this step, every extracted figure carries both structured metadata and the actual image it came from, ready for visual analysis.
Measuring extraction confidence
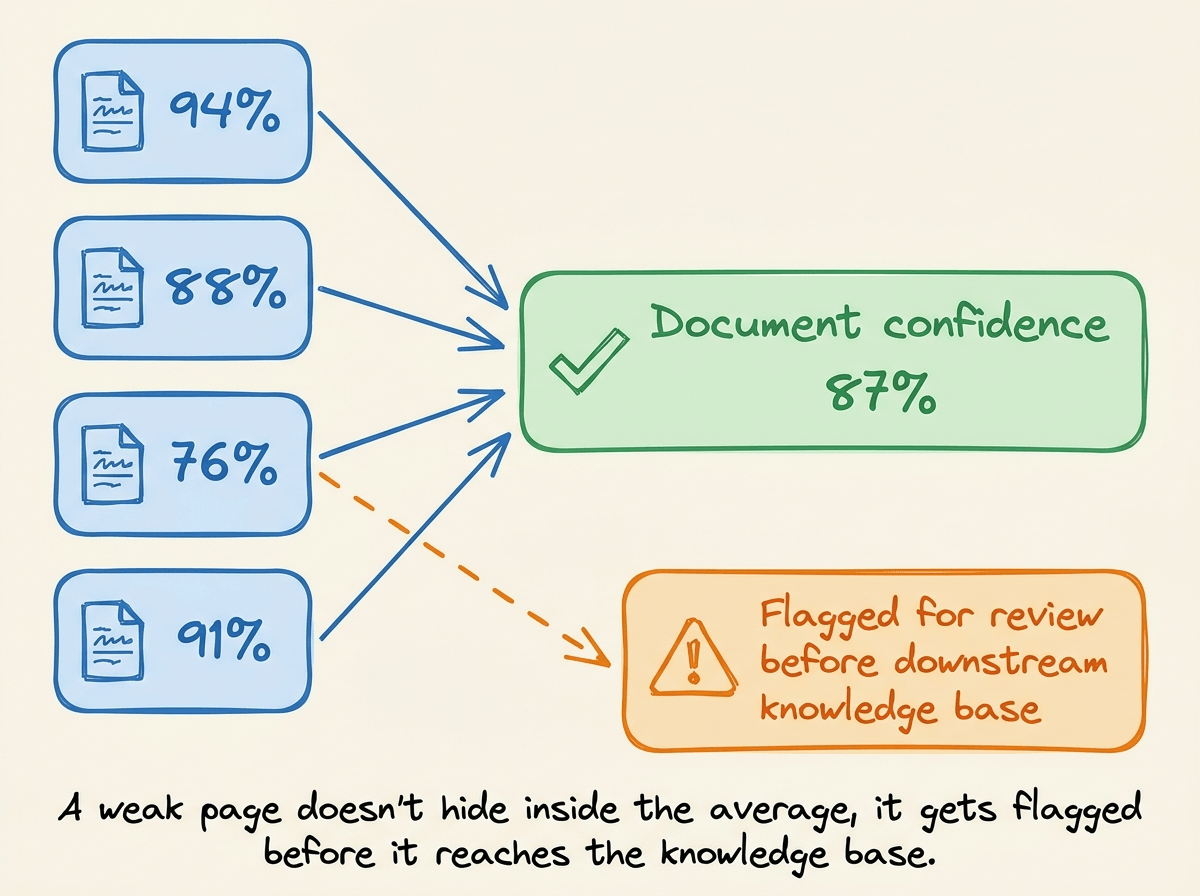
Mistral OCRv4 can also return a confidence score for every processed page.
The pipeline averages those page-level scores into a single document confidence, as an average confidence percentage.
In a production pipeline, this becomes a useful signal for automatically flagging low-confidence pages before their extractions flow into a downstream knowledge base.
Notice what we’ve built so far. At this stage, the pipeline has only extracted the document into a structured representation and recovered every figure.
It still hasn’t tried to understand what those charts actually mean.
That’s the next layer.
Coordinating agentic figure analysis
Once Mistral OCRv4 has extracted the figures, a CrewAI flow orchestrates the rest of the pipeline.
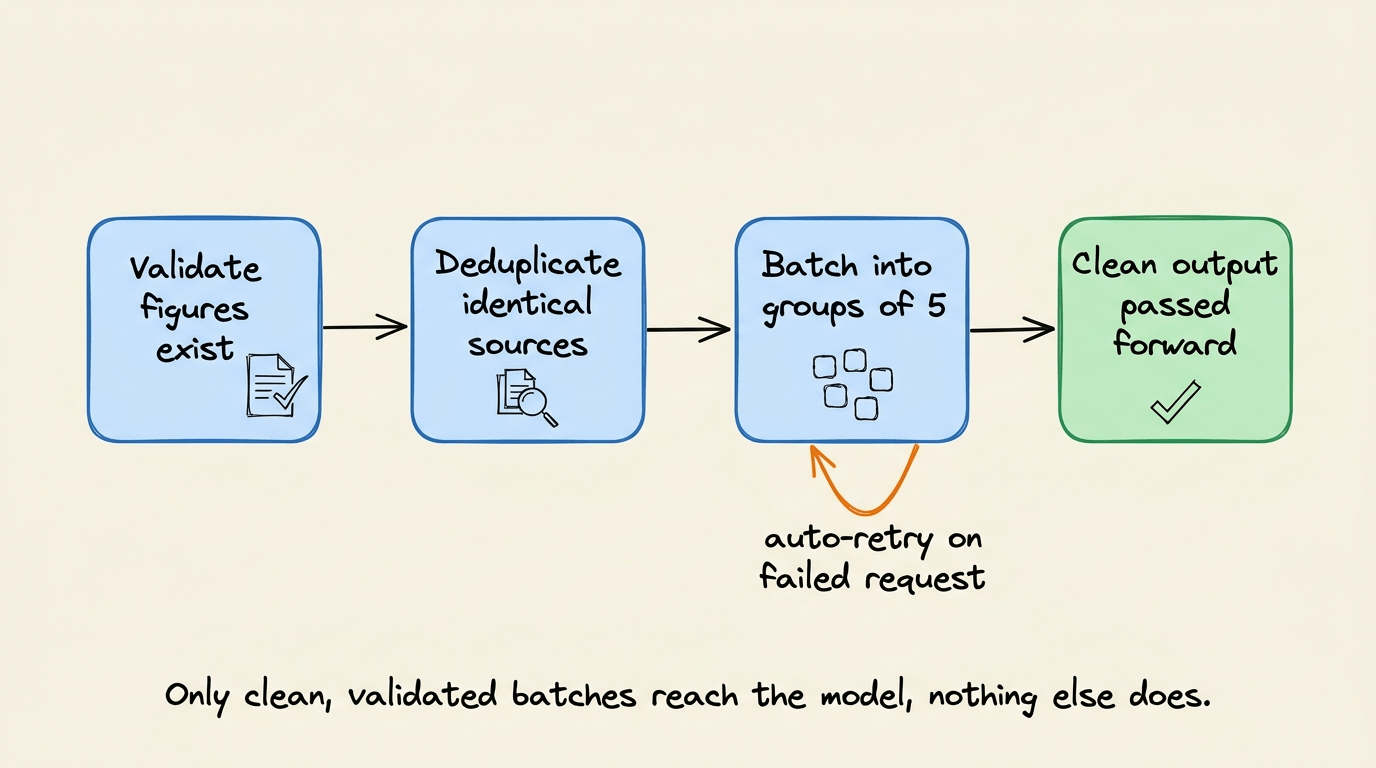
Rather than sending every extracted image straight to an LLM, the flow first prepares the workload before any model is called.
It:
validates that the document actually contains figures to analyze
removes duplicate figures that point to the same source image
batches the figures into groups of five for efficient inference, with automatic retries if a request fails
passes only clean, validated output from one step to the next
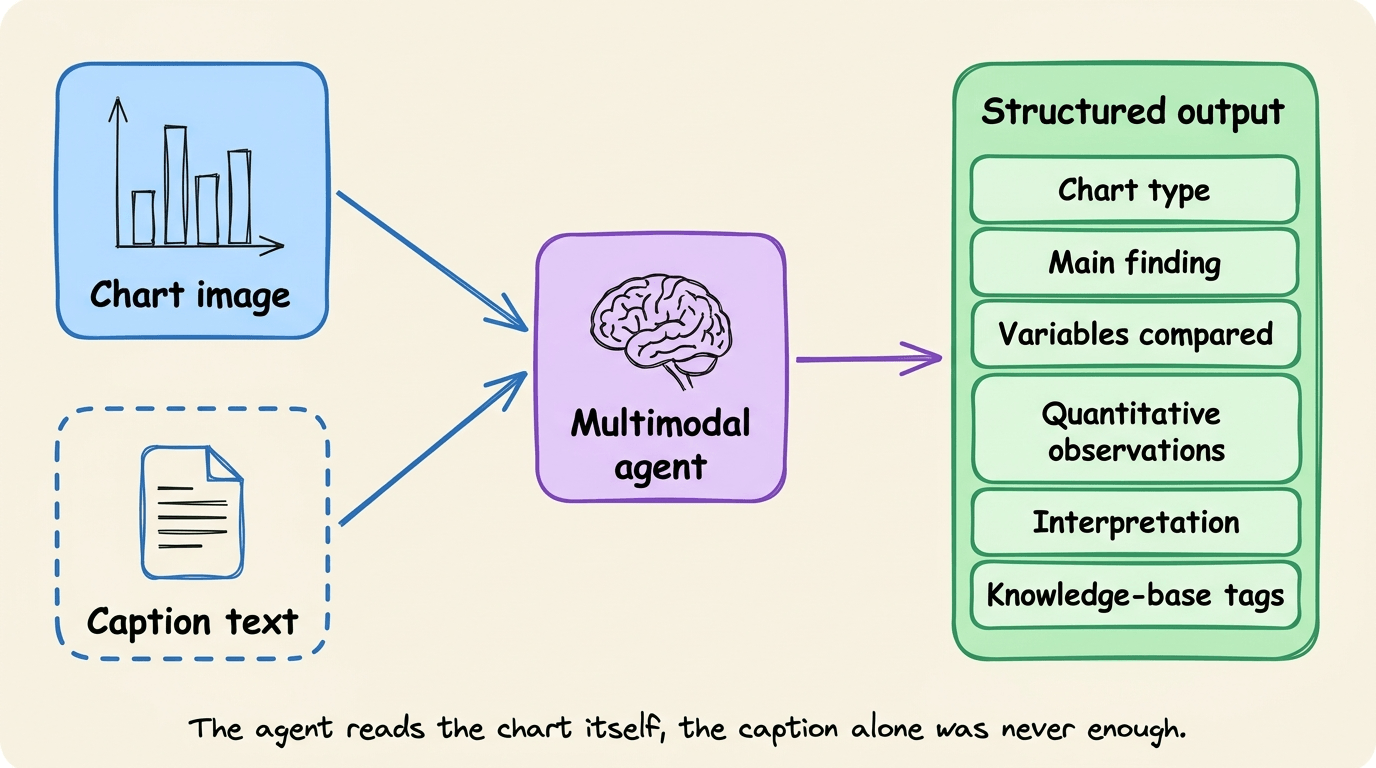
With the figures prepared, the flow passes each image to a multimodal agent for analysis.
The agent looks at the figure itself and not just the surrounding caption to understand what the chart is showing.
The agent runs on Mistral Small 4, wired into CrewAI as a multimodal LLM:
from crewai import Agent

figure_analyst = Agent(
    config=agents_config["figure_analyst"],
    llm=LLM(
        model="mistralai/mistral-small-2603",
        reasoning_effort="none",
    ),
    multimodal=True,
)
So the pipeline uses two Mistral models for two different jobs:
Mistral OCRv4 extracts the figures and their surrounding document context.
Mistral Small 4 reads the extracted figure images and interprets what they show.
For each figure, the agent reads the axis labels, legends, plotted data, and visual trends alongside the caption.
It then returns structured fields including the chart type, main finding, variables being compared, quantitative observations, interpretation, and knowledge-base tags.
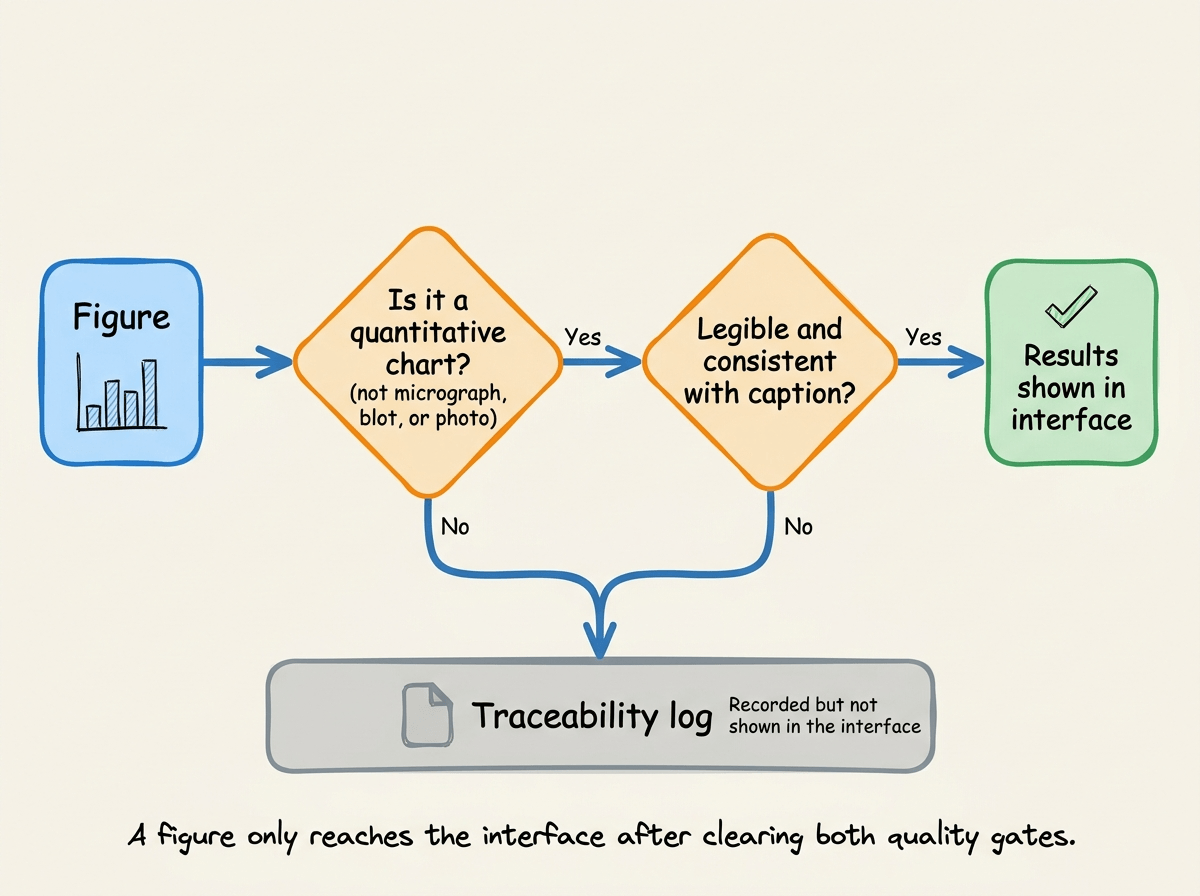
Before a figure reaches the final output, the agent performs two validation checks.
It verifies that the image is actually a quantitative chart rather than a micrograph, western blot, or photograph, and that the figure is legible and consistent with its caption.
Figures that fail either check are still recorded for traceability, but they’re excluded from the results shown in the interface.
The whole pipeline
By this point, we've looked at each component individually.
Here's how they work together from the moment a paper is uploaded to the moment structured figure intelligence appears in the application.
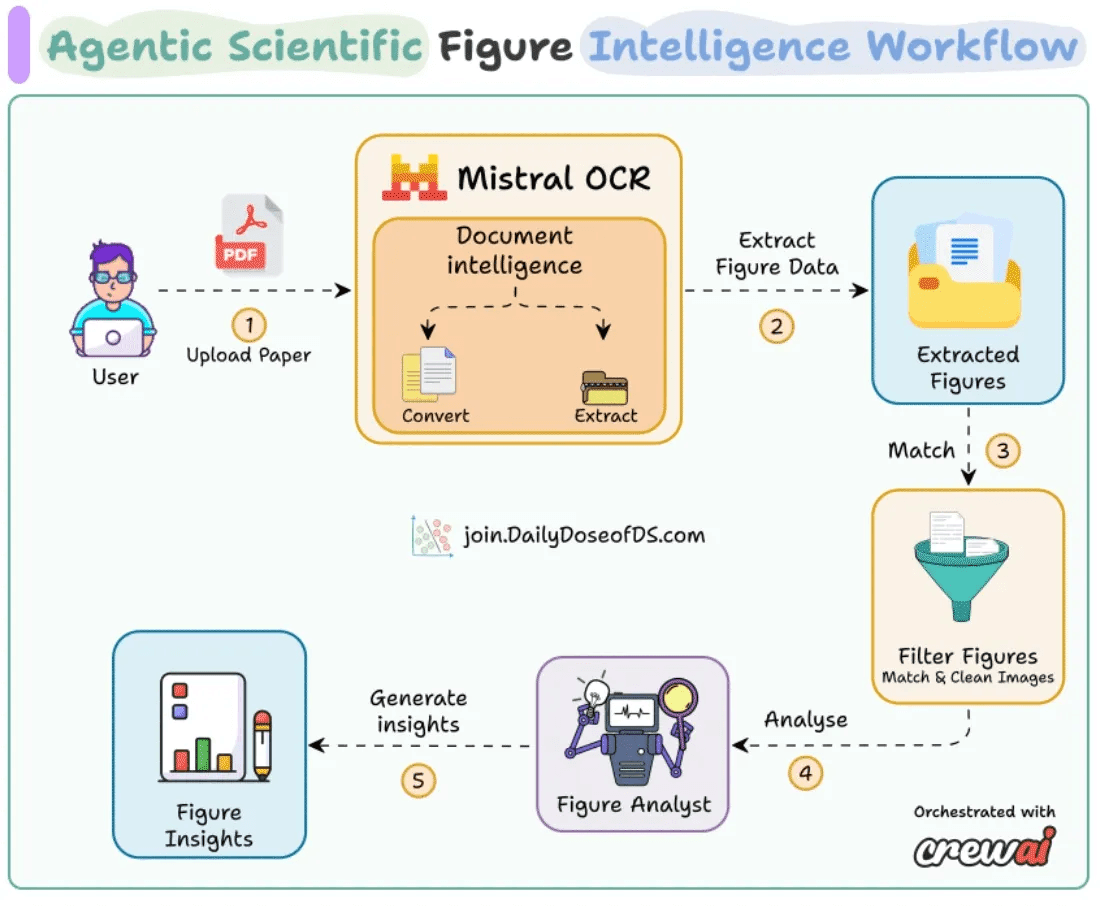
User uploads a scientific PDF.
Mistral OCRv4 runs a pass to identify and structure all figures
The agent flow validates extraction quality and routes accordingly
A multimodal analyst agent produces structured intelligence
Results are displayed in the UI with a figure thumbnail.
That said, this pipeline isn’t only about processing figures accurately and faster. It changes what you can do with an entire paper collection.
Coverage: Every figure in every paper becomes a structured record. Nothing disappears because a chart type was unfamiliar or a caption was vague.
Consistency: Every figure goes through the same extraction pipeline, the same multimodal agent, and the same schema. The output no longer depends on who happened to review the paper.
Queryability: Variables, entities, chart types, quantitative findings, and knowledge-base tags are structured from the start, making them immediately searchable and ready for downstream RAG or analytics.
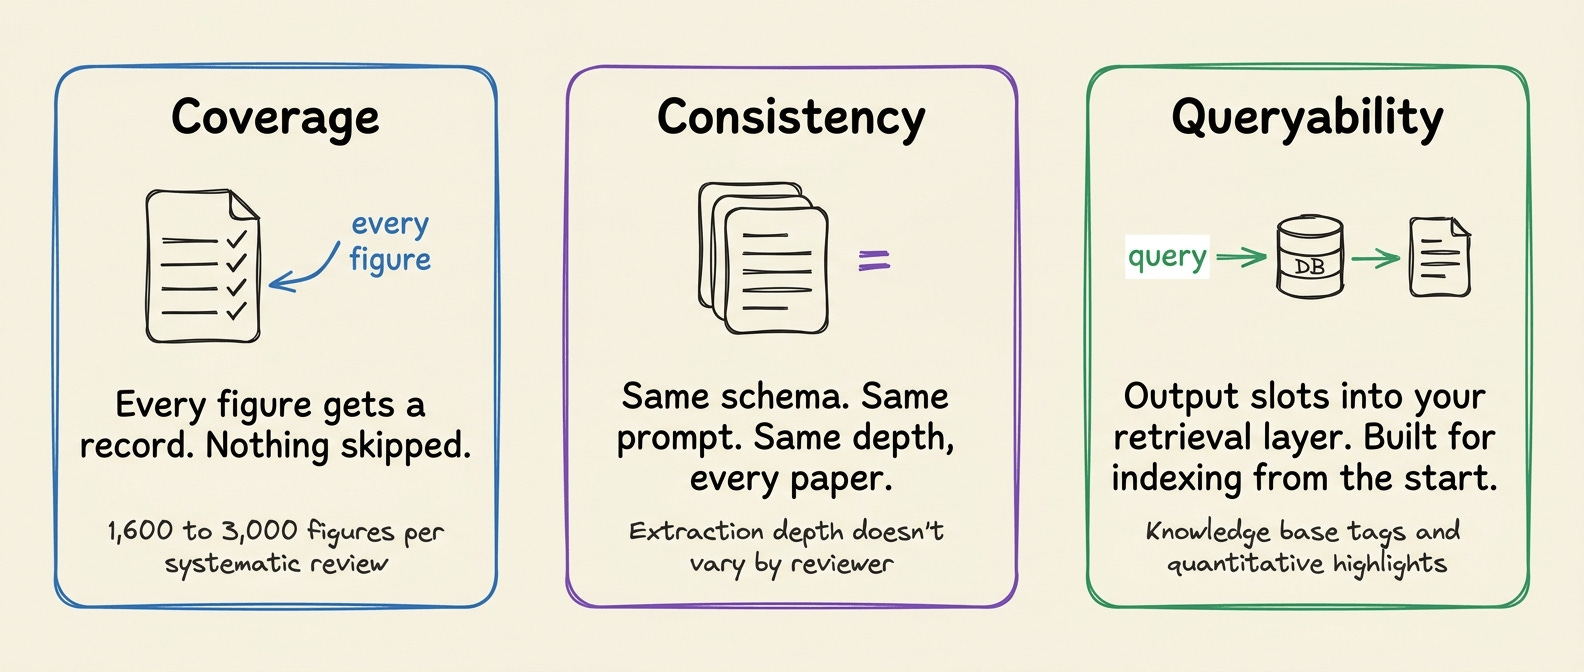
A systematic review of 200 papers can easily contain 1,600–3,000 figures. Reviewing and cataloging those manually takes weeks, produces inconsistent annotations, and leaves results that are difficult to search afterward.
The result isn't just another OCR output. Every paper becomes a structured collection of searchable figure records, complete with extracted metadata, chart summaries, confidence scores, and the original figure images.
Here’s what one processed paper looks like in the application:
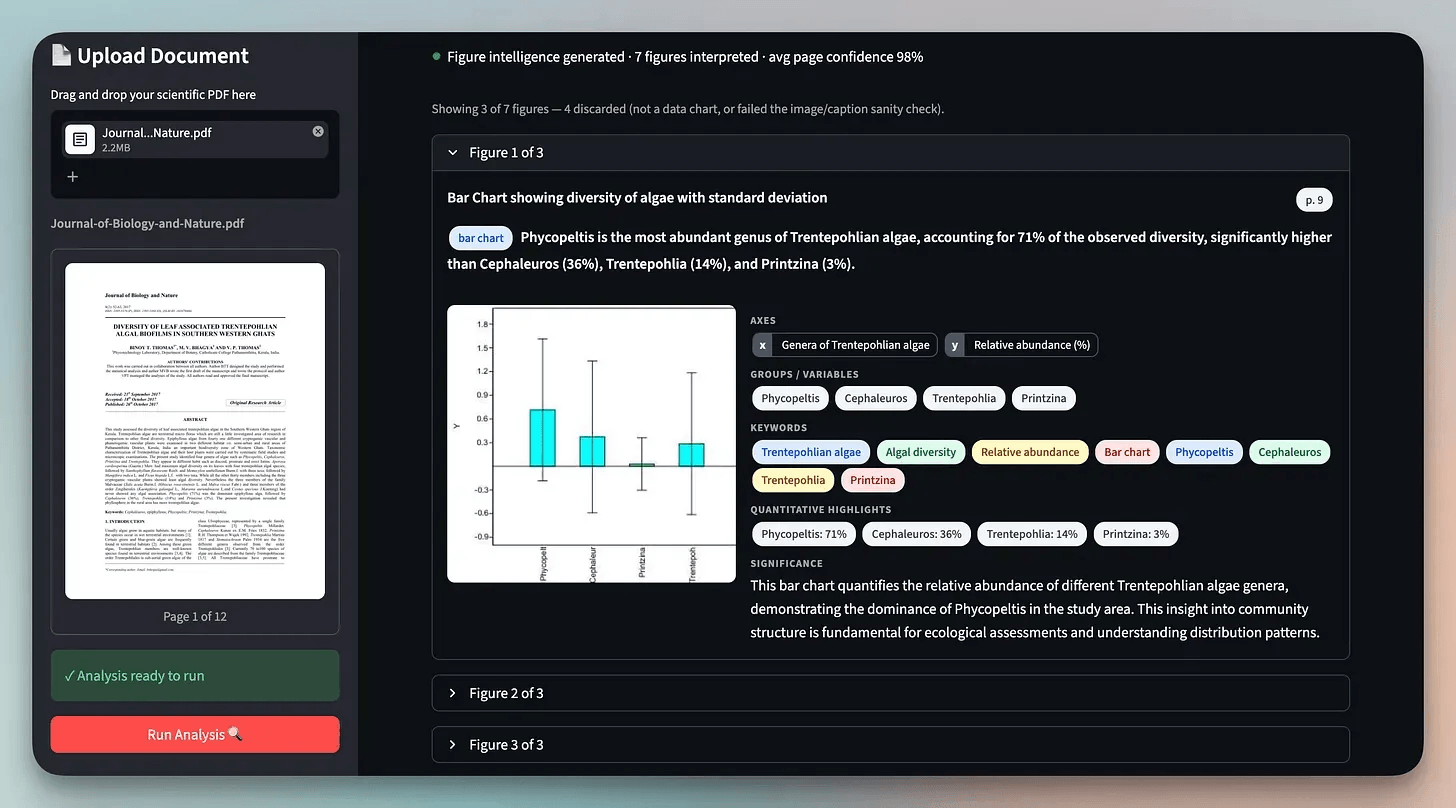
With a structured pipeline, every figure becomes searchable data instead of another image buried inside a PDF.
Running the pipeline in production
The demo in this article uses a public paper. Production deployments often don’t.
Many organizations process unpublished experiments, proprietary datasets, clinical studies, or internal research.
Every document sent to a cloud API reveals what you’re working on, even if the model never stores the data.
For those environments, keeping document processing inside your own infrastructure stops being a preference and becomes a requirement.
Mistral OCRv4 is available as a self-hosted deployment, so the same extraction pipeline can run entirely inside your own environment.
One practical advantage of this architecture is that the application doesn’t change. The extraction request, schema, and downstream agent pipeline stay the same whether OCR runs through the hosted API or a self-hosted deployment.
Moving from one to the other is primarily a deployment decision rather than an application rewrite.
Explore Mistral OCRv4 through Mistral Studio →
Good day!