
How are QQ Plots Created?
Creating one from scratch.

GroundX: An enterprise-grade RAG solution

If you don't want to send your data to OpenAI or any external servers...
Try GroundX On-Prem, the ultimate secure and scalable RAG solution you can use locally or on-premise.
GroundX is designed to process complex, real-world documents that can have images, tables, and flowcharts along with regular text.
What makes it a game-changer:
Great Python SDK
Compatible with any Kubernetes setup
Secure storage for data and vectors
Ingest service fine-tuned on 1M+ documents
Supports hybrid RAG pipelines effortlessly
GroundX consistently beats leading RAG tools for handling complex, large-scale documents.
Thanks to EyeLevel for partnering today!
How are QQ Plots Created?
A QQ plot lets you visually assess the similarity between two distributions:
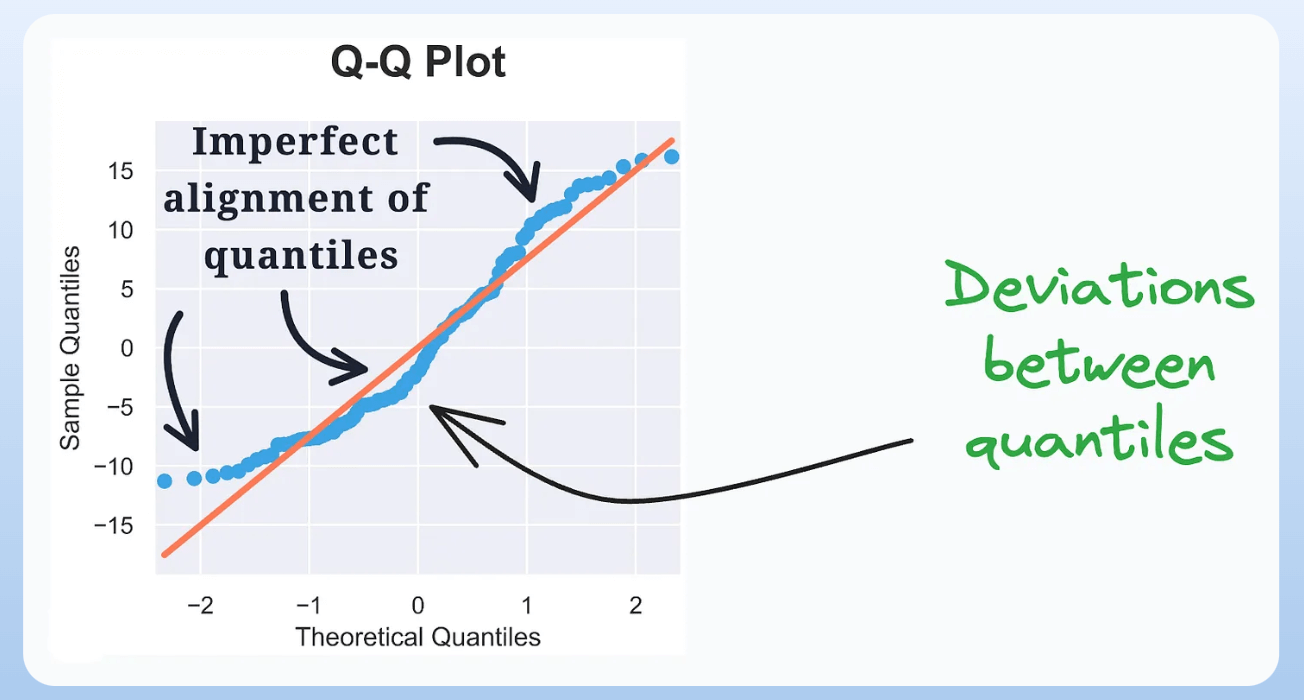
By plotting the quantiles of the two distributions against each other, we can look at the deviations from the straight line to determine the differences between the two distributions.
But how is it created?
Let’s understand today!
The following visual depicts this process:
Consider two distributions—D1 and D2.
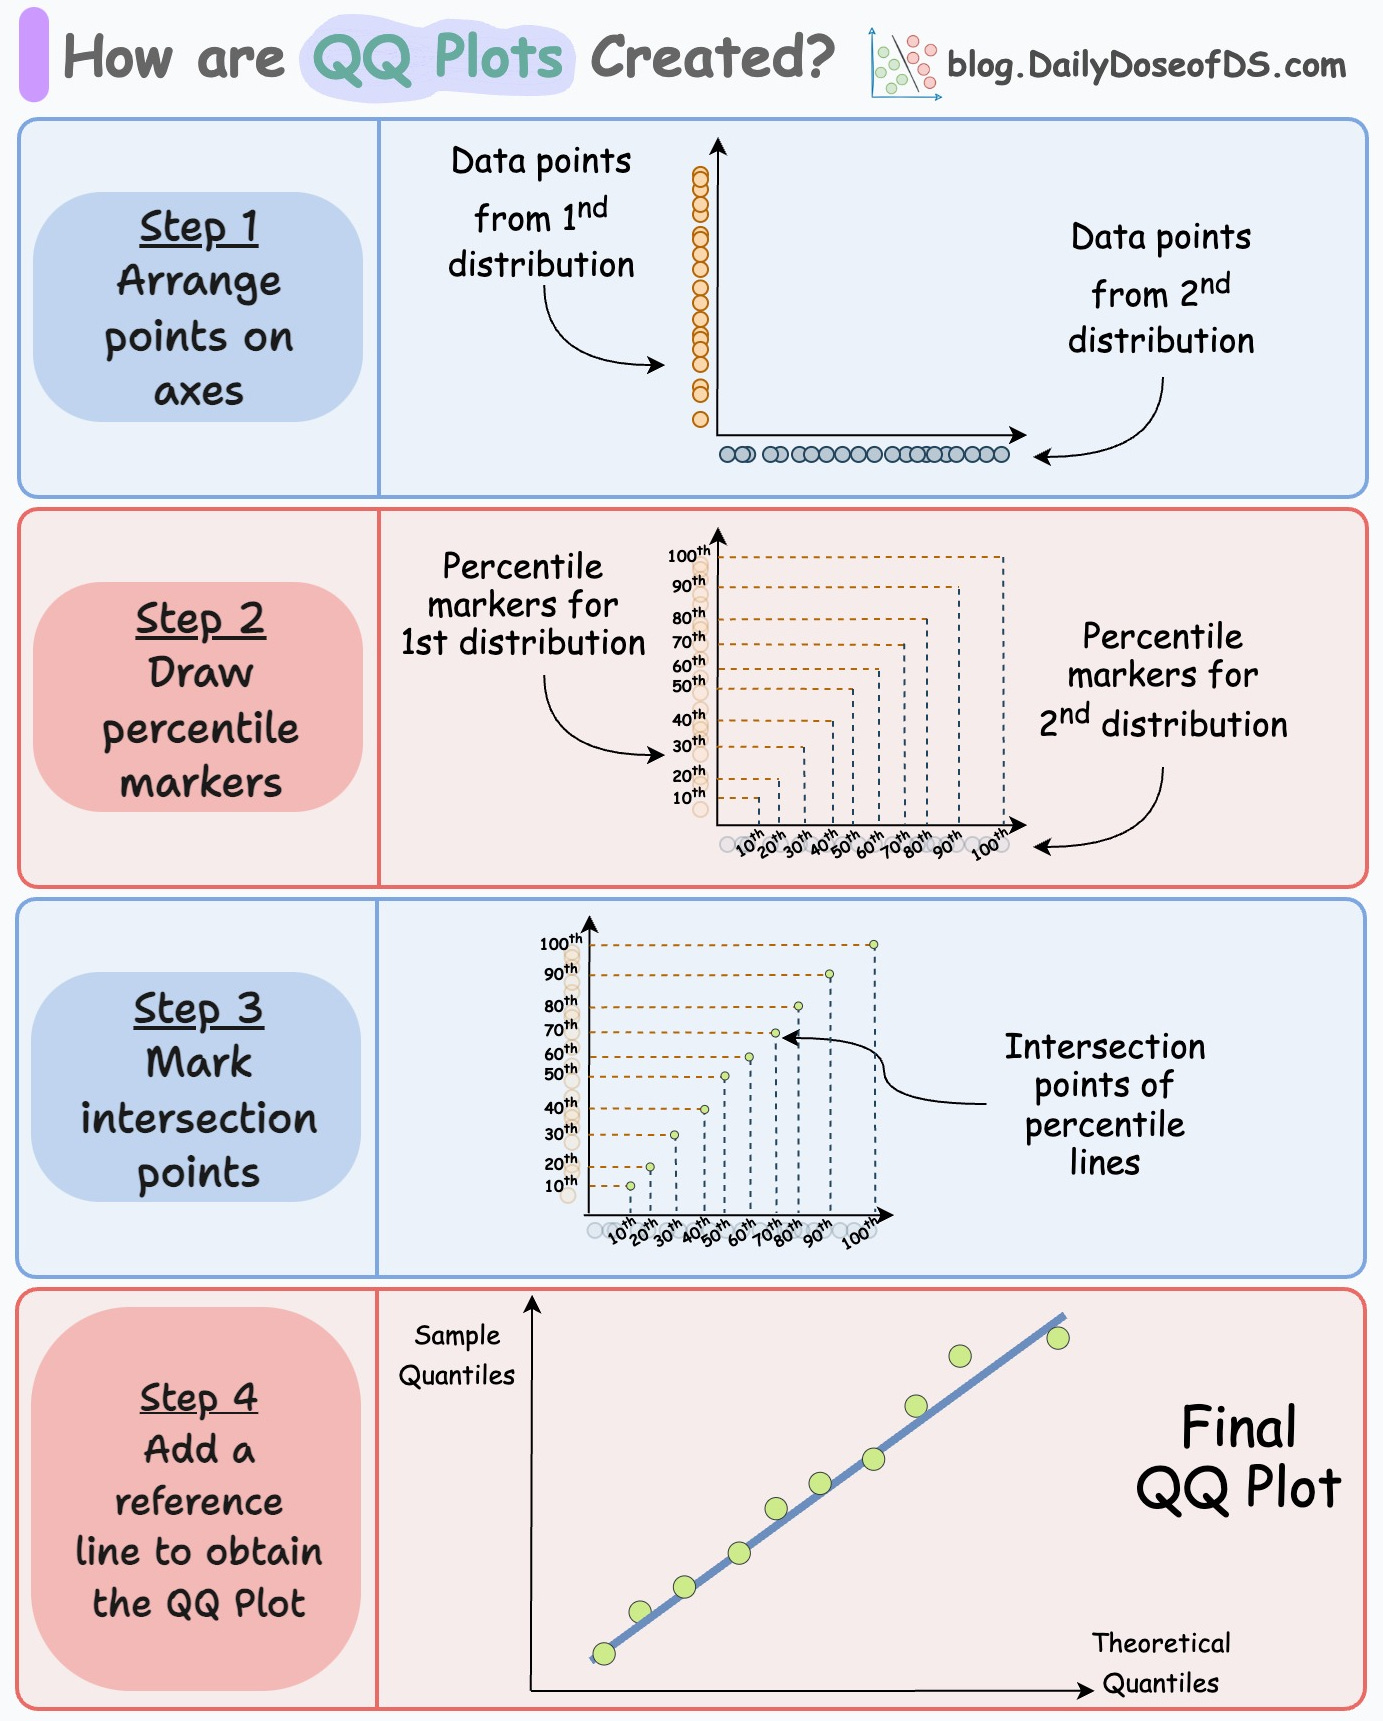
Step 1) Arrange points on axes:
Arrange points of D1 on the y-axis and D2 on the x-axis.

Step 2) Draw percentile lines
Create some percentile lines for both distributions.
For instance, mark the points of 10th percentile, 20th percentile, 30th percentile, etc. Once marked, intersect the corresponding lines:
Match the 10th percentile of D1 with 10th percentile of D2.
Match the 20th percentile of D1 with 20th percentile of D2.
and so on.

The intersection points gives us the points in a QQ plot:

Now, remove the percentile marker lines.

In a gist, the above plot depicts the location where the corresponding percentiles of the two distributions match.
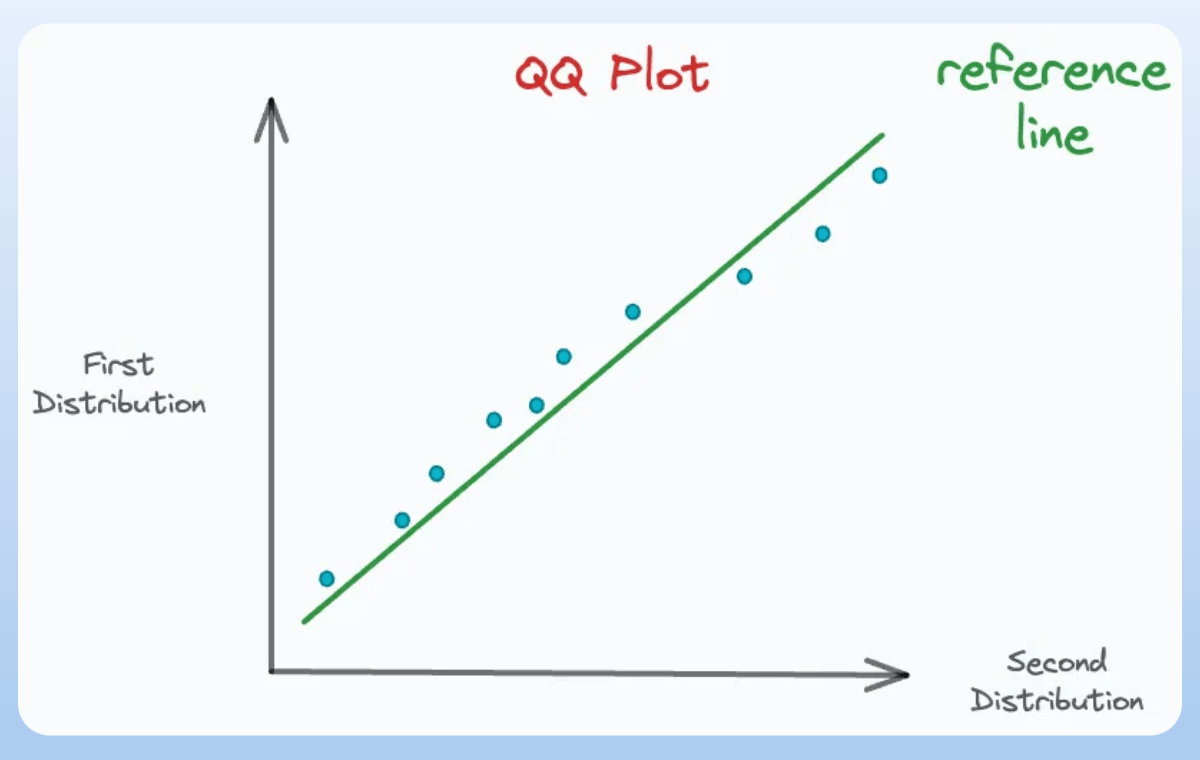
Step 3) Add the reference line
Finally, add a reference line to determine the deviations between the two distributions. There are many ways to do this:
Draw a line connecting the 25th and 75th percentiles of both distributions.
Or, create a regression fit on the above scatter plot.
Typically, option #1 is preferred since a regression fit can be influenced by outliers.
Adding the reference lines gives this QQ plot:
The deviations from this reference line mean that the corresponding percentiles do not align, which is an indicator of dissimilarity:

And the more percentiles we plot, the more accurate the QQ plot we get.
There are many applications of the QQ plot.
Imagine we want to determine if a distribution resembles a normal distribution. We can use a QQ plot for this.
D1: The observed distribution
D2: Normal distribution.
The closer the percentile points are to the reference line, the more the observed distribution matches a normal distribution:

👉 Over to you: What other plots do you typically struggle with and want me to cover?
Thanks for reading!
P.S. For those wanting to develop “Industry ML” expertise:

At the end of the day, all businesses care about impact. That’s it!
Can you reduce costs?
Drive revenue?
Can you scale ML models?
Predict trends before they happen?
We have discussed several other topics (with implementations) that align with such topics.
Here are some of them:
Learn sophisticated graph architectures and how to train them on graph data: A Crash Course on Graph Neural Networks – Part 1.
So many real-world NLP systems rely on pairwise context scoring. Learn scalable approaches here: Bi-encoders and Cross-encoders for Sentence Pair Similarity Scoring – Part 1.
Learn techniques to run large models on small devices: Quantization: Optimize ML Models to Run Them on Tiny Hardware.
Learn how to generate prediction intervals or sets with strong statistical guarantees for increasing trust: Conformal Predictions: Build Confidence in Your ML Model’s Predictions.
Learn how to identify causal relationships and answer business questions: A Crash Course on Causality – Part 1
Learn how to scale ML model training: A Practical Guide to Scaling ML Model Training.
Learn techniques to reliably roll out new models in production: 5 Must-Know Ways to Test ML Models in Production (Implementation Included)
Learn how to build privacy-first ML systems: Federated Learning: A Critical Step Towards Privacy-Preserving Machine Learning.
Learn how to compress ML models and reduce costs: Model Compression: A Critical Step Towards Efficient Machine Learning.
All these resources will help you cultivate key skills that businesses and companies care about the most.