How to Assess Correlation on Ordinal Data?
The problem with Pearson correlation.
[REMINDER] We have moved to a new platform
We have started moving from Substack (our current newsletter platform) to another platform.
Switch for free here: https://switch.dailydoseofds.com.
Right away, you will receive an email with some instructions.
Done!
Correlation on Ordinal Data
If your correlation analysis includes ordinal features (those with a natural encoding, like t-shirt size, grade, etc.)...
...the choice of encoding can largely affect the correlation results.
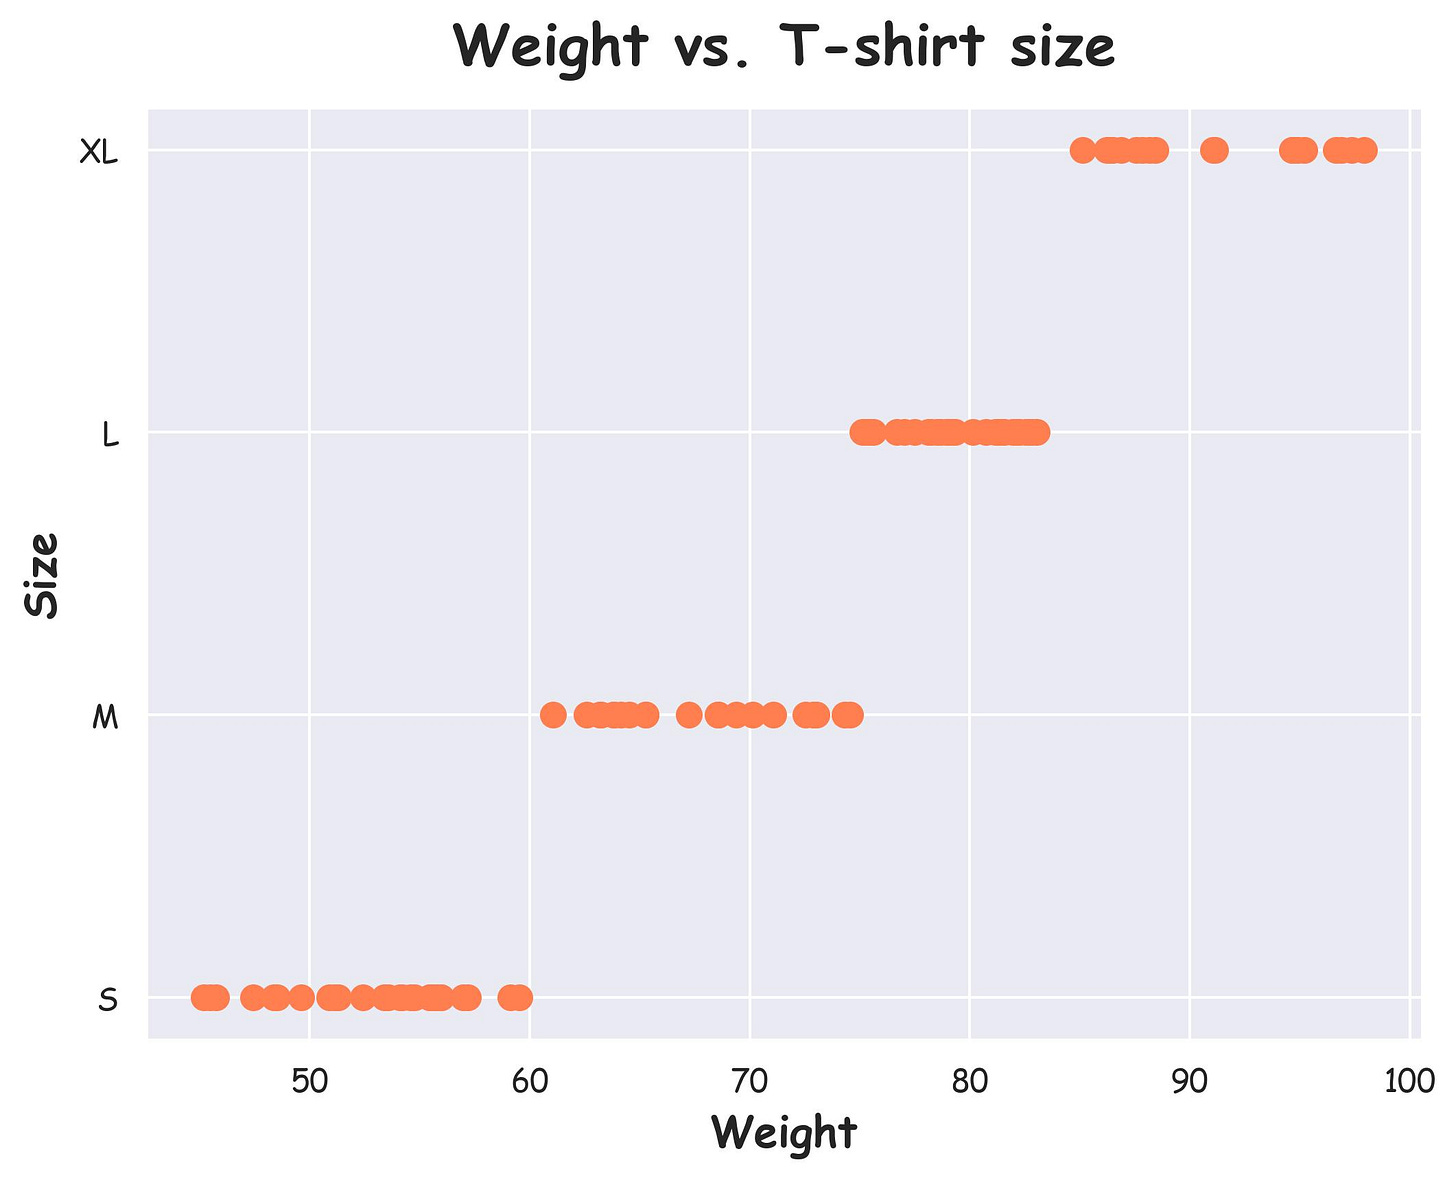
For instance, consider this dataset.
Here, we have:
An ordinal categorical feature: t-shirt size (S, M, L, XL).
A continuous feature: weight.
The graph above shows a monotonic relationship between the two features.
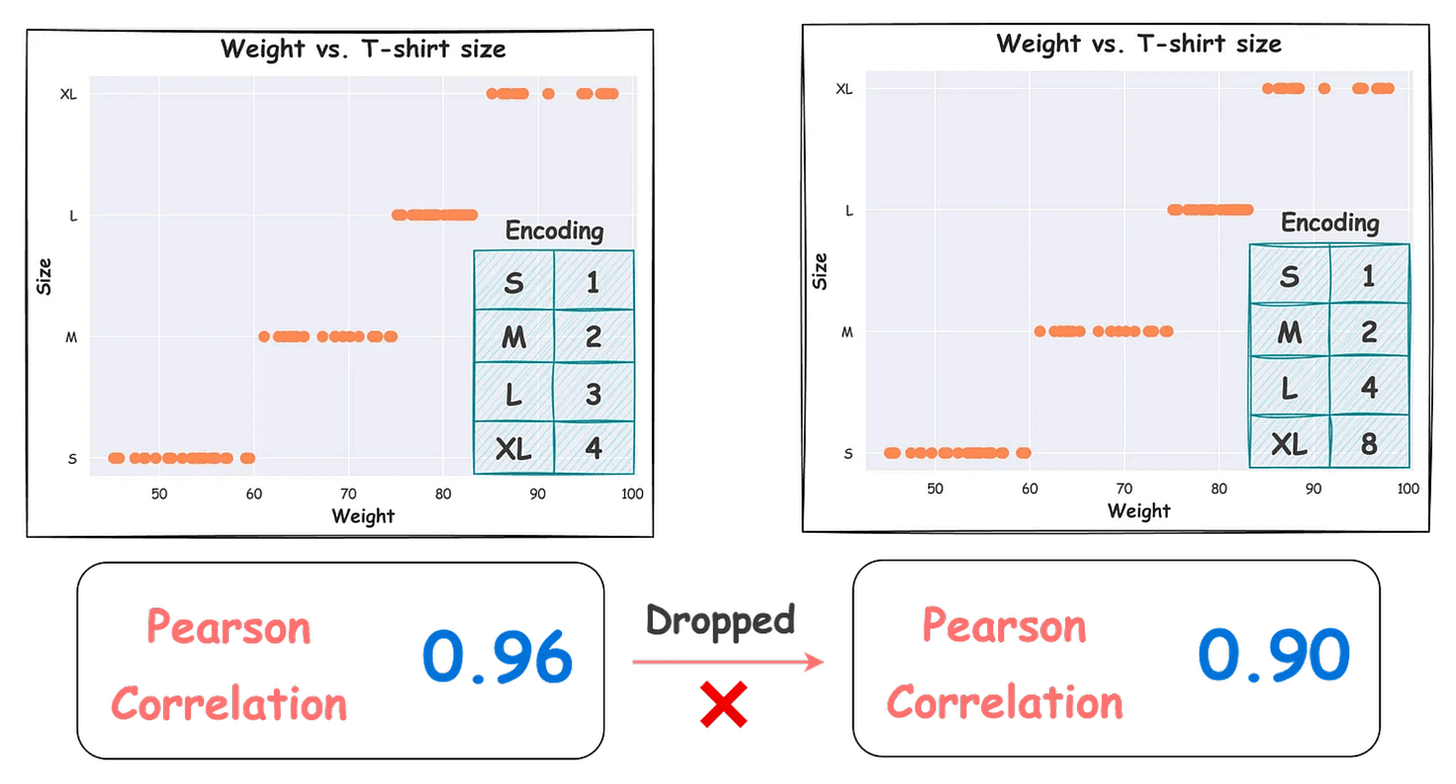
If we use Pearson correlation (as shown below), the choice of encoding determines the actual correlation value:
In the left plot, we have this encoding → S(1), M(2), L(3) and XL(4).
In the right plot, we have this encoding → S(1), M(2), L(4) and XL(8).
However, using Spearman correlation solves this issue:
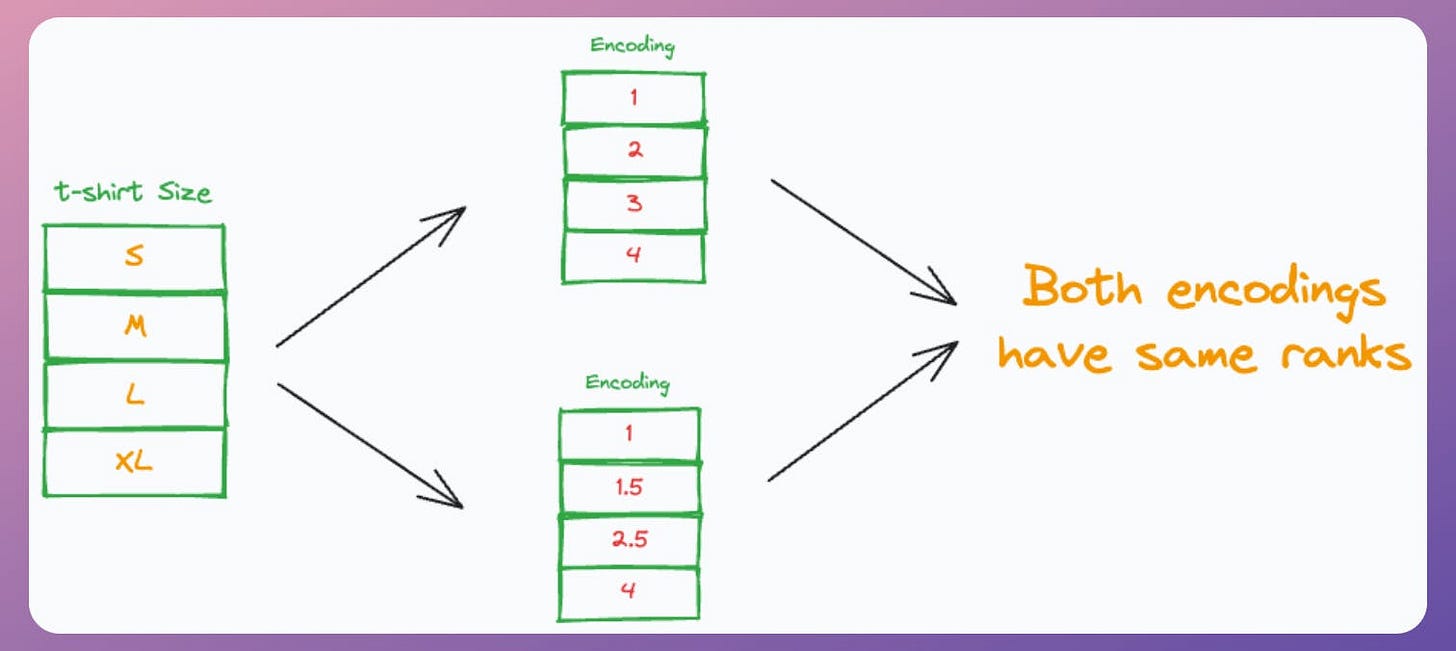
This time, the correlation value is the same.
This happens because the Spearman correlation is rank-based.
In other words, since it operates on the “ranks” of the data, it is more suitable for such cases of correlation analysis.
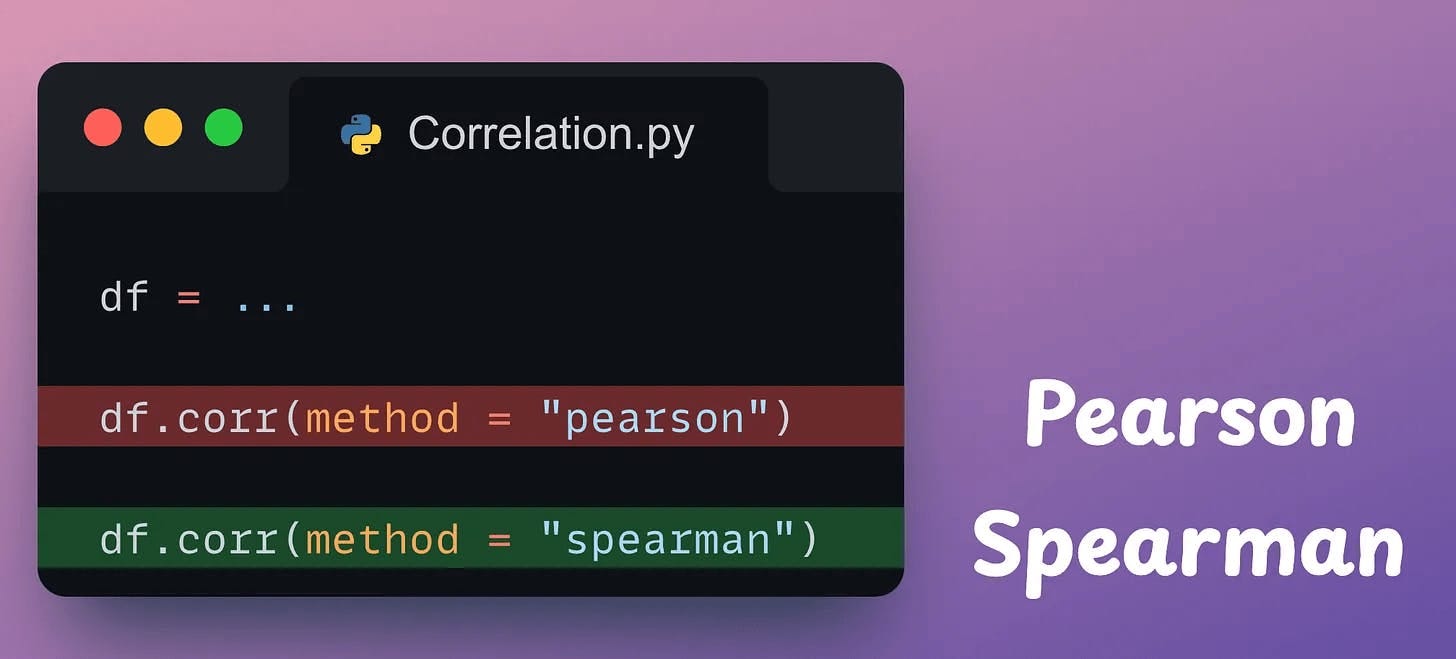
Using Spearman correlation is pretty simple. If you are using Pandas, just specify the desired correlation measure as follows:
That said, there’s one more thing to take care of when you are training ML models to predict ordinal categorical data.
Ordinal datasets are quite prevalent in the industry, and typical classification models almost always produce suboptimal results in such cases.
With special attention and techniques, however, one can not only add more interpretability to ML models but also produce more accurate machine learning models.
We covered them in detail here: You Are Probably Building Inconsistent Classification Models Without Even Realizing.
👉 Over to you: What are some other measures to determine the correlation between categorical data and continuous data?
P.S. For those wanting to develop “Industry ML” expertise:
We have discussed several other topics (with implementations) in the past that align with such topics.
Here are some of them:
Learn sophisticated graph architectures and how to train them on graph data: A Crash Course on Graph Neural Networks – Part 1
Learn techniques to run large models on small devices: Quantization: Optimize ML Models to Run Them on Tiny Hardware
Learn how to generate prediction intervals or sets with strong statistical guarantees for increasing trust: Conformal Predictions: Build Confidence in Your ML Model’s Predictions.
Learn how to identify causal relationships and answer business questions: A Crash Course on Causality – Part 1
Learn how to scale ML model training: A Practical Guide to Scaling ML Model Training.
Learn techniques to reliably roll out new models in production: 5 Must-Know Ways to Test ML Models in Production (Implementation Included)
Learn how to build privacy-first ML systems: Federated Learning: A Critical Step Towards Privacy-Preserving Machine Learning.
Learn how to compress ML models and reduce costs: Model Compression: A Critical Step Towards Efficient Machine Learning.
All these resources will help you cultivate key skills that businesses and companies care about the most.
SPONSOR US
Get your product in front of 450k+ data scientists and other tech professionals.
Our newsletter puts your products and services directly in front of an audience that matters — thousands of leaders, senior data scientists, machine learning engineers, data analysts, etc., who have influence over significant tech decisions and big purchases.
To ensure your product reaches this influential audience, reserve your space here or reply to this email to ensure your product reaches this influential audience.


