
Introduction to Quantile regression
...explained with code.

Lightning AI + Voltage Park: One Platform, Zero Infrastructure Headaches

If you’ve ever trained a model on one platform, deployed it on another, and spent weeks just keeping it alive, you know the pain. Lightning AI and Voltage Park just merged to fix exactly that.
For AI devs, this means training and deploying on the same platform without switching tools or rewriting code.
You get virtually unlimited GPU burst and reservation capacity across 35,000+ owned H100s, B200s, and GB300s. When you need to scale a training run or handle inference spikes, the infrastructure is already there.
Your existing Lightning workflows stay intact while you focus on building models instead of managing infrastructure.
Thanks to Lightning for partnering today!
Quantile regression
Regression models typically generate a point estimate, which isn’t always useful.
Consider a model predicting salary based on job title, years of experience, and education level.
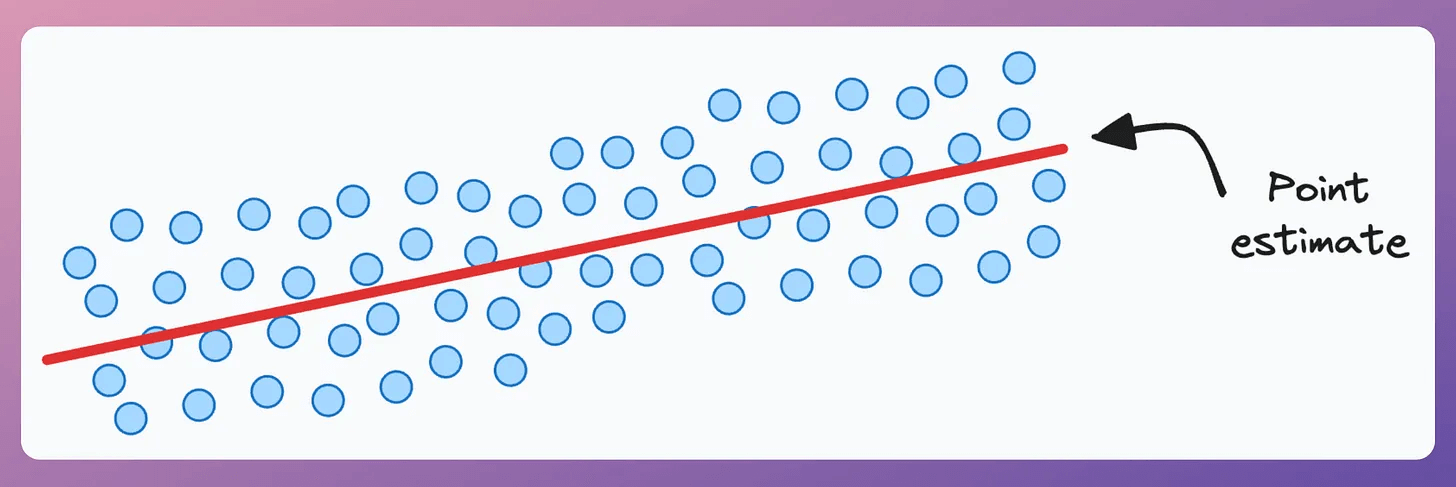
A traditional regression model provides a scalar salary estimate, specifically, the mean value of the outcome at a particular input.
More specifically, the prediction is a mean value related to the outcome at a particular input. If you read the article on generalized linear models, we discussed it there.
But a single value of $80k doesn’t tell you much. What’s more useful is getting quantiles to assess best-case and worst-case scenarios:
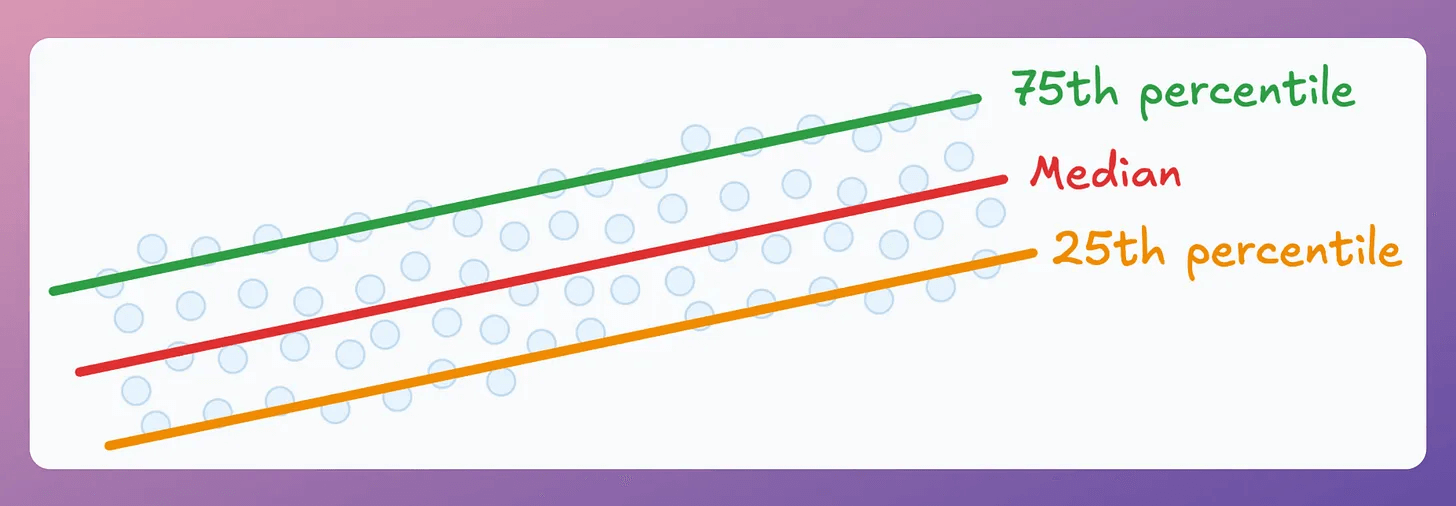
25th percentile → $65k (25% of employees in similar roles earn $65k or less)
50th percentile → $80k (The median)
75th percentile → $95k (25% of employees earn $95k or more)
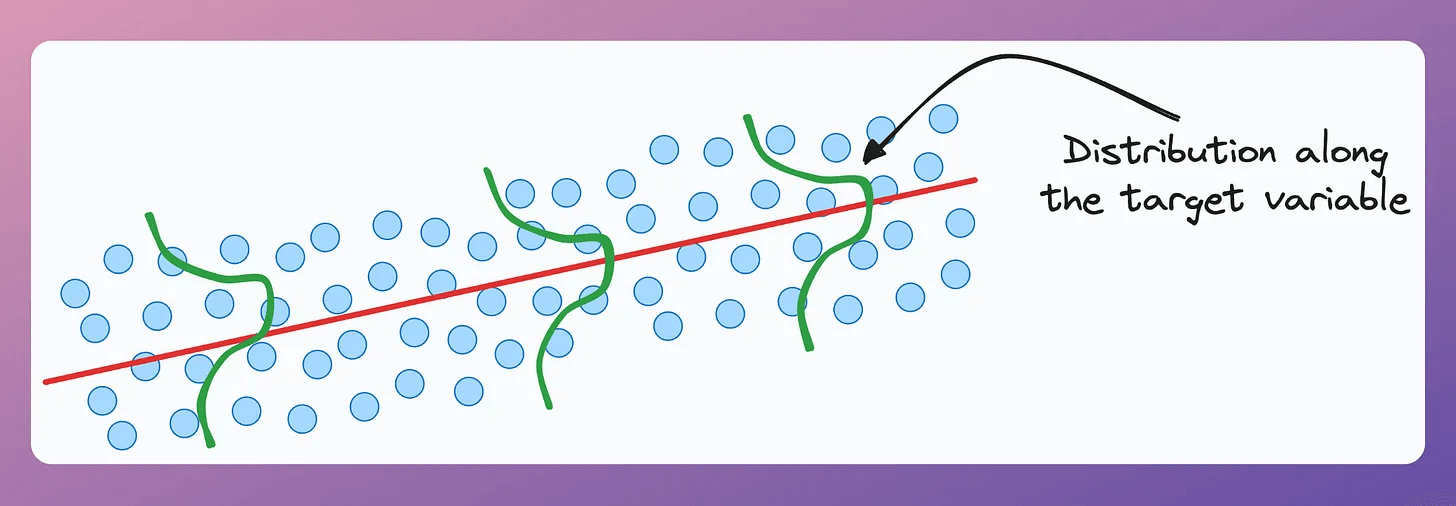
This makes sense since there’s always a distribution along the target variable, and a point estimate doesn’t capture that.
Quantile regression solves this.
What is Quantile Regression?
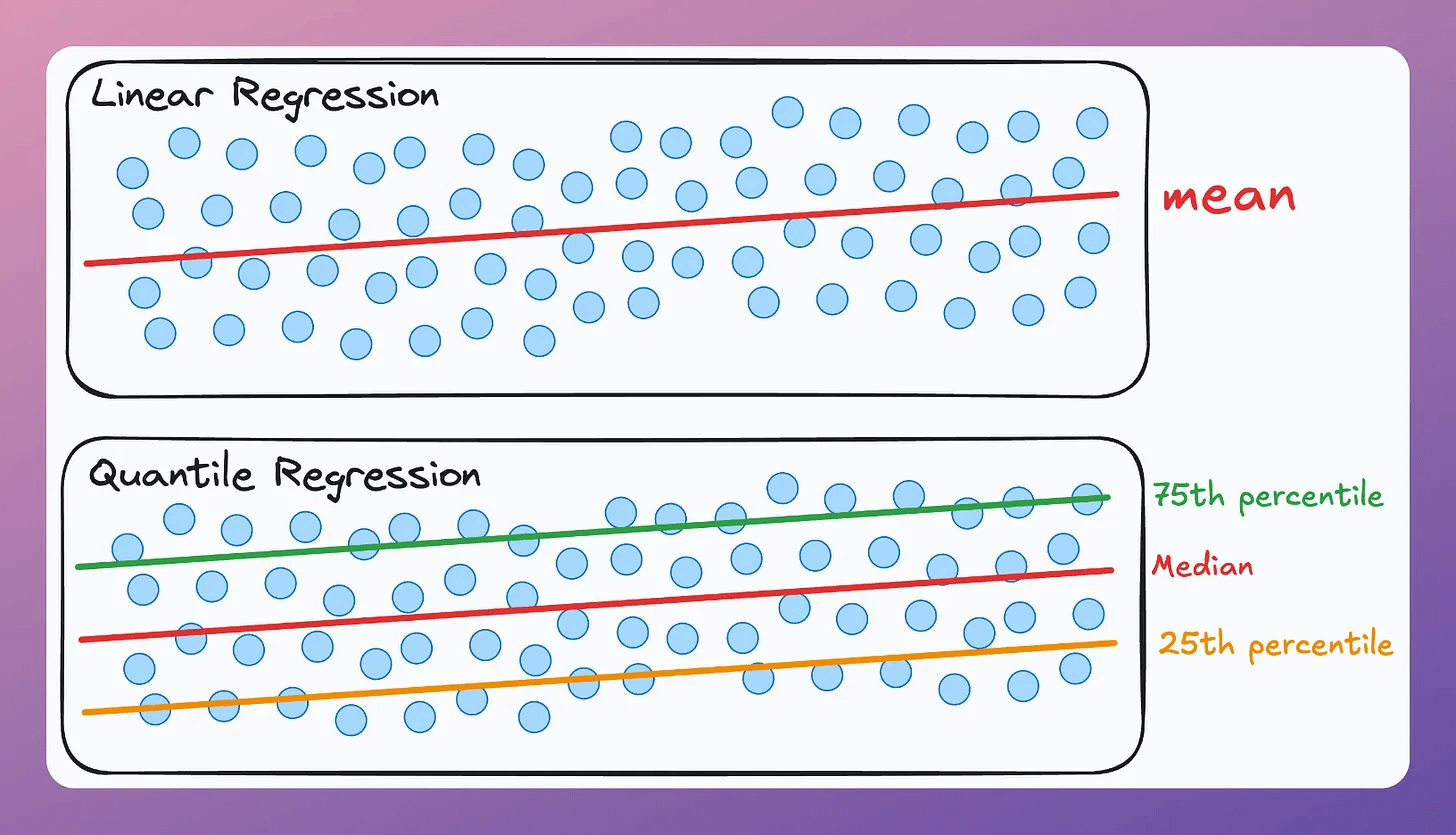
Quantile regression estimates quantiles of the response variable conditioned on the input. Unlike OLS, which estimates the mean, quantile regression provides estimates for various percentiles.
How does it work?
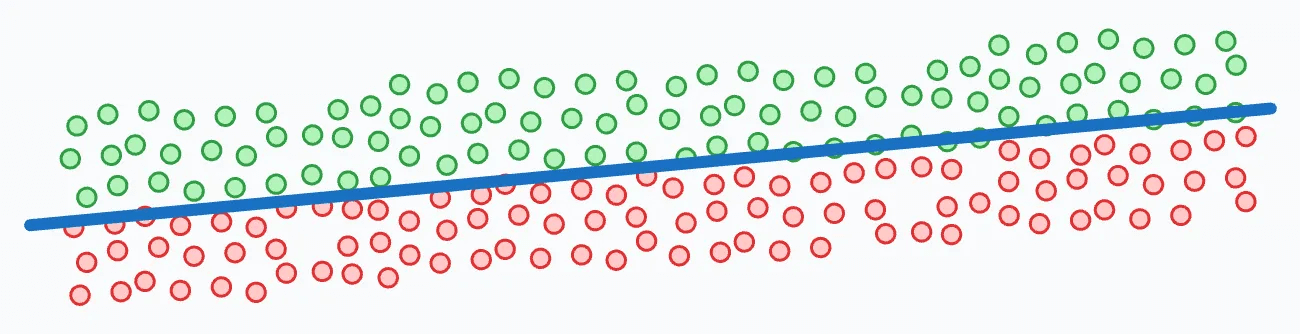
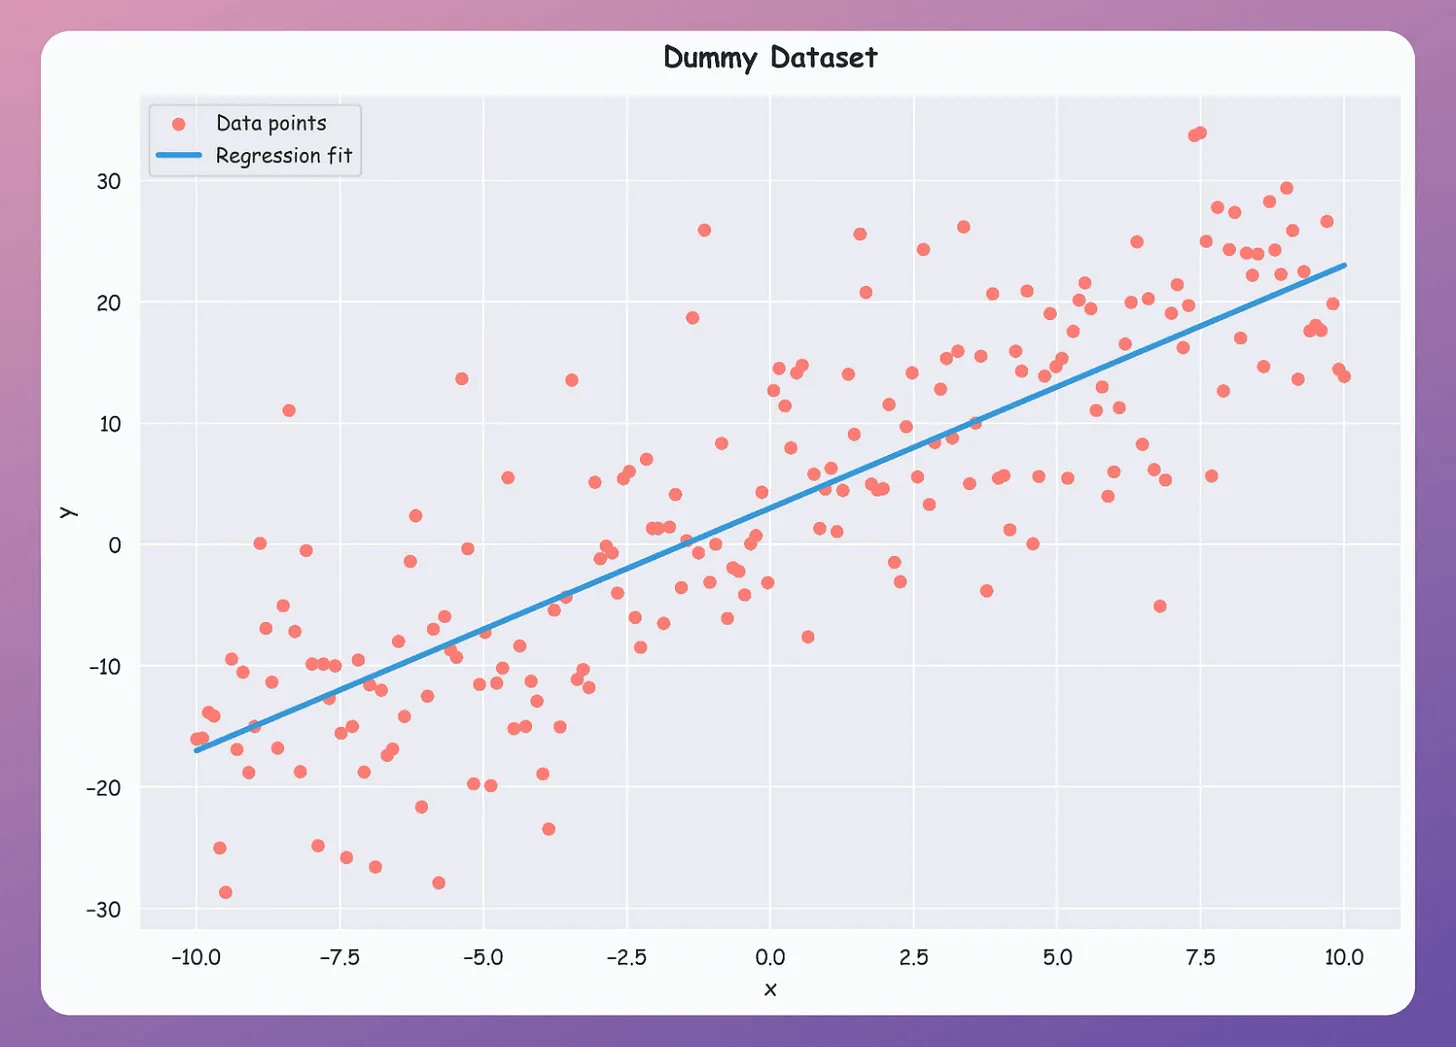
Consider this dummy dataset with a linear regression fit:
Points in green have positive error (true - predicted).
Points in red have negative error.
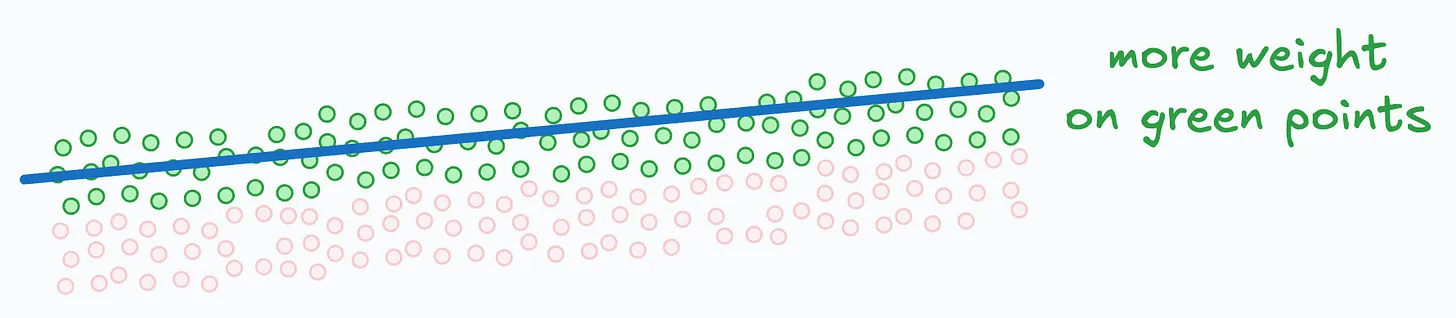
Here’s the trick:
To generate the 75th percentile line, assign more weight to the green points. This pulls the prediction line upward.

To generate the 25th percentile line, assign more weight to the red points. This pulls the line downward.

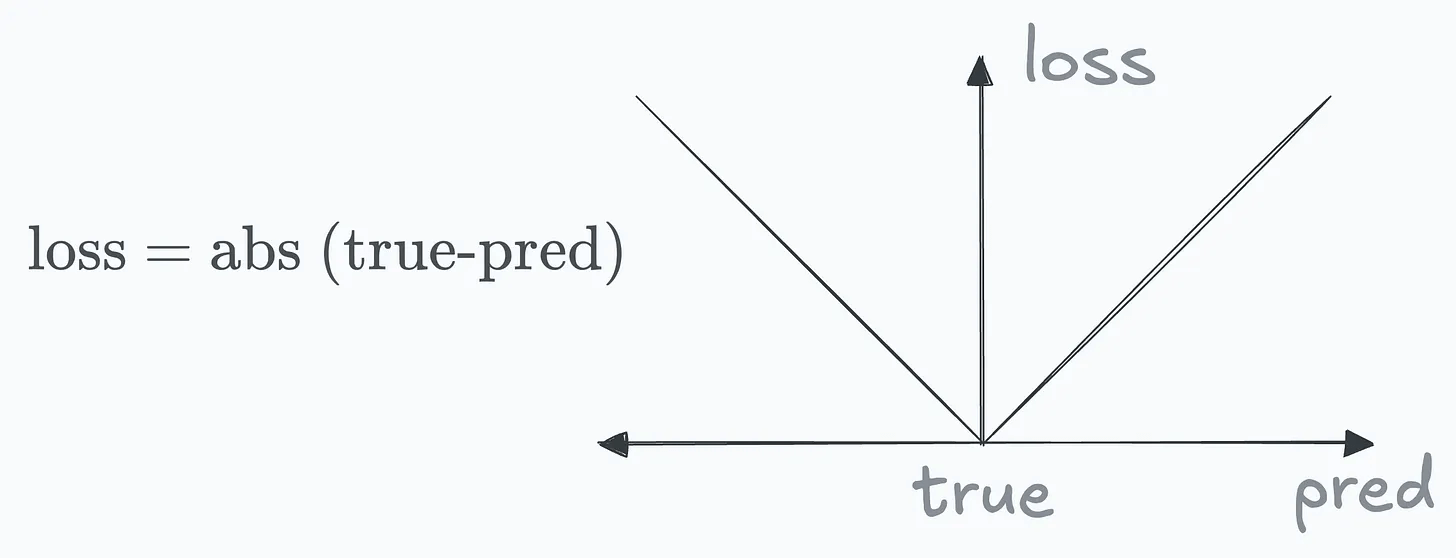
To put it another way, the standard error term in linear regression assigns equal loss to predictions equidistant on either side of the actual value.
However, we can parameterize this loss function with a weight “w” so the loss differs on either side:
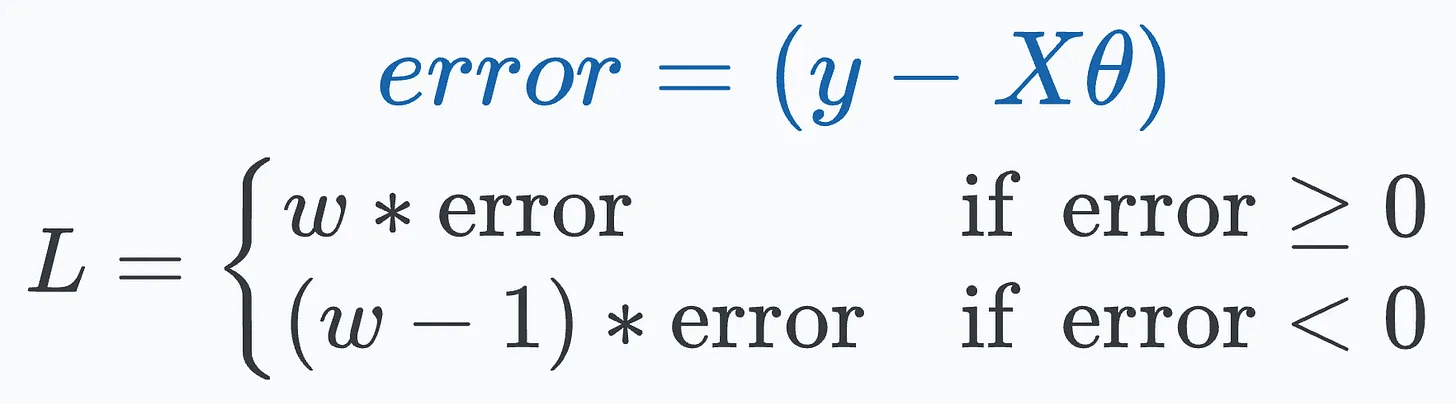
If w>0.5, we get the plot on the left, and if w<0.5, we get the plot on the right:
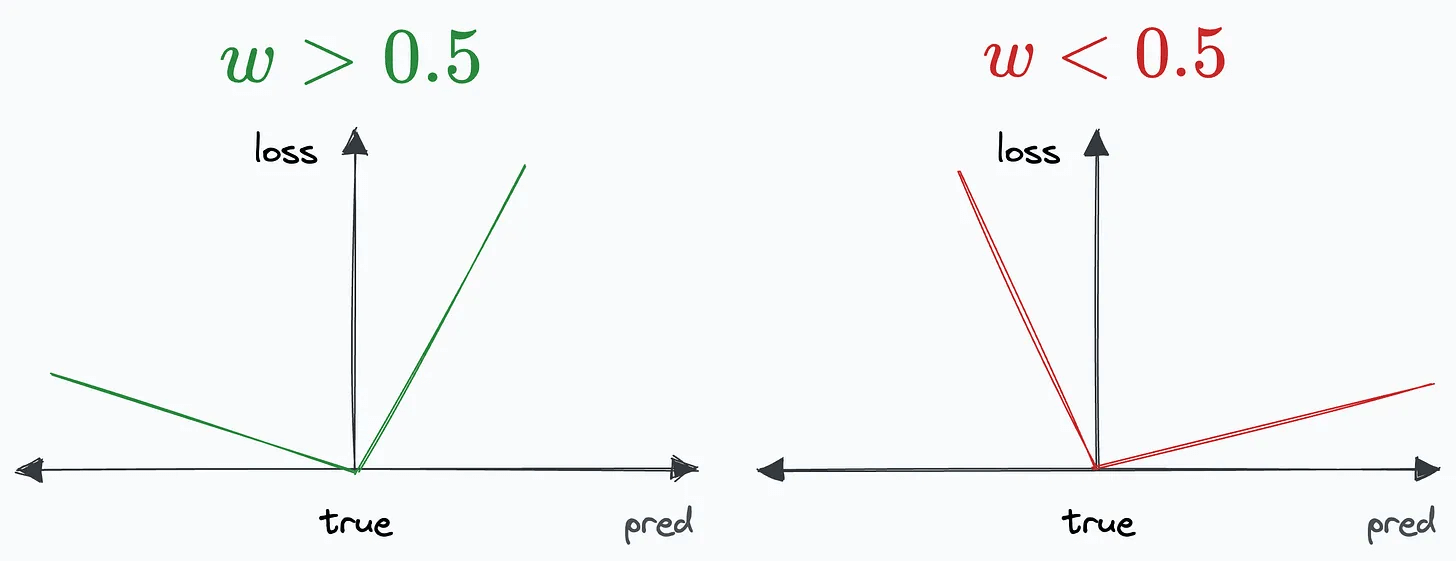
This is called quantile loss (or pinball loss).
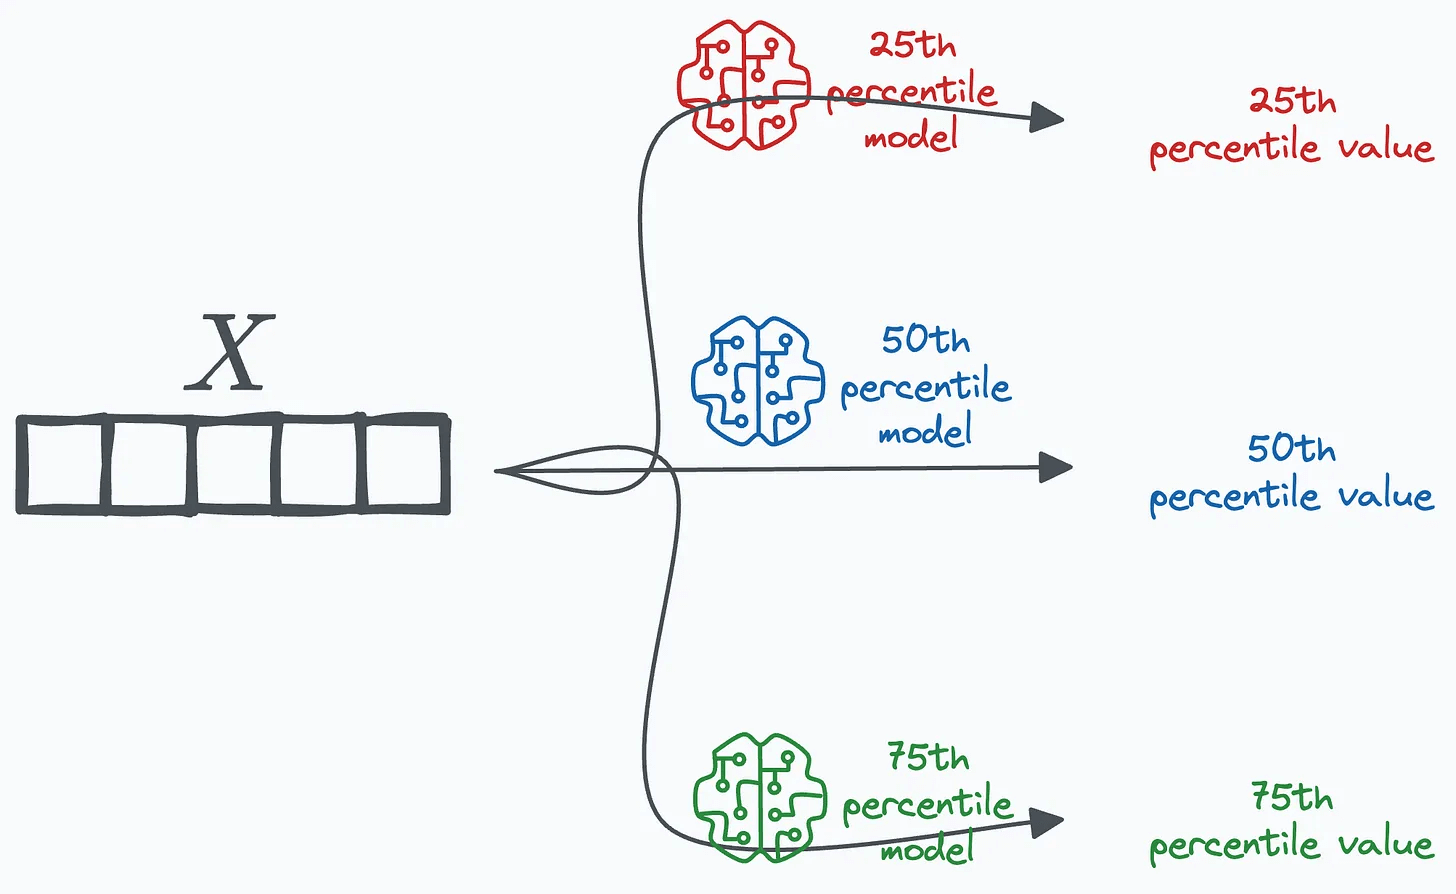
We then train multiple regression models, one per quantile:
75th percentile → w = 0.75
50th percentile → w = 0.50
25th percentile → w = 0.25
During inference, pass the input through each model to get quantile-level predictions.
Implementation from scratch
Consider a dummy dataset with its OLS regression fit. We’ll train multiple regression models, one for every quantile value.
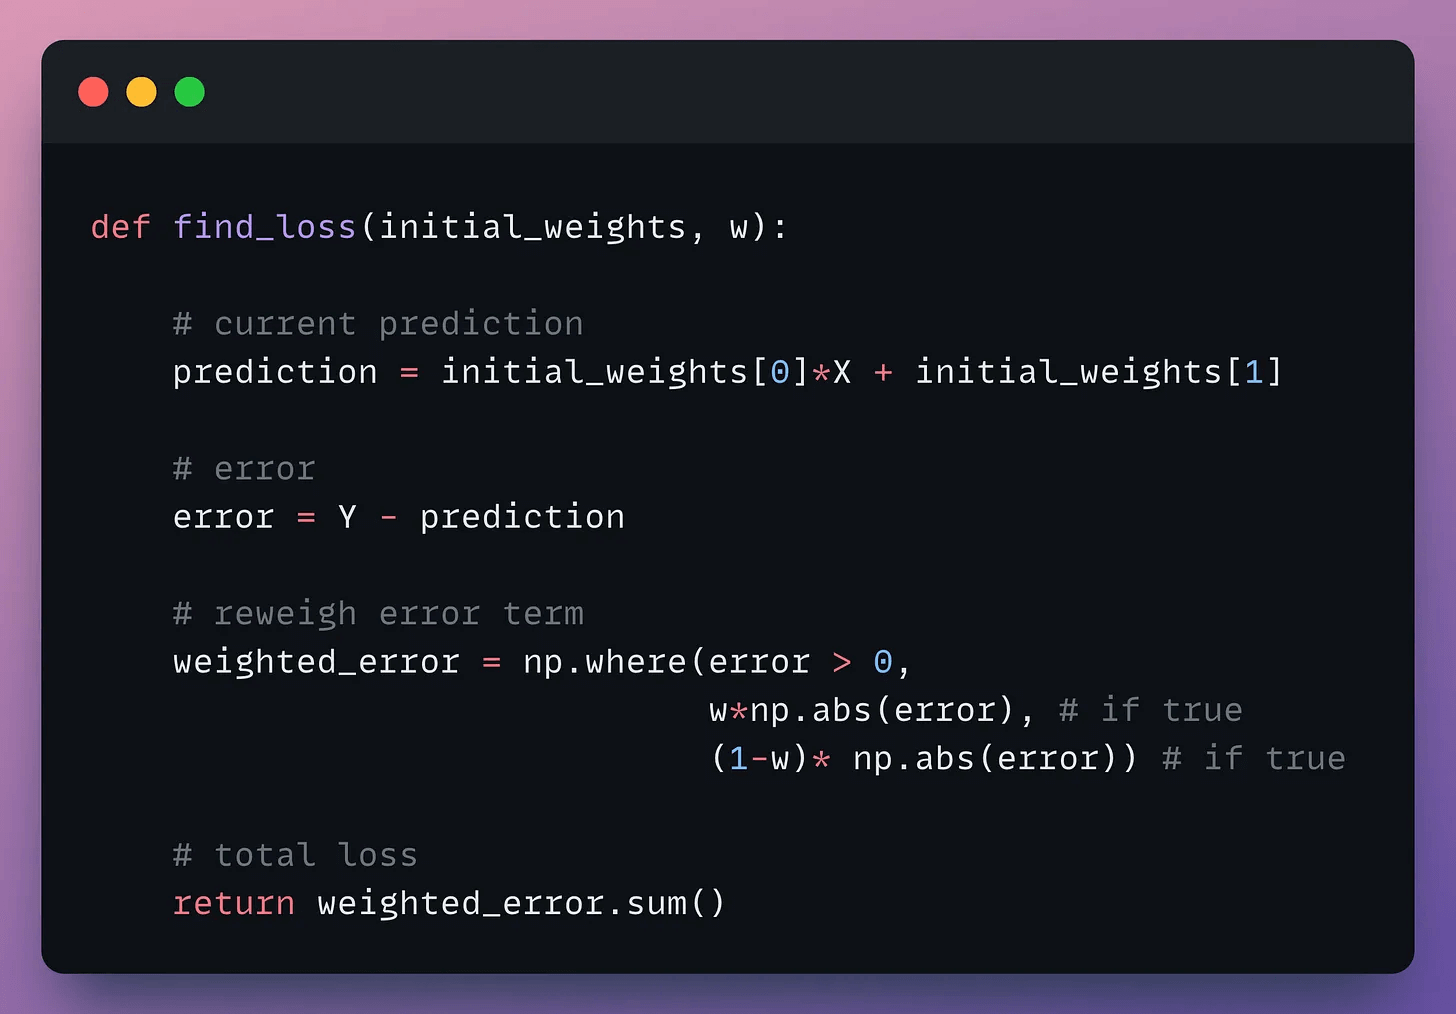
The loss function:

Here’s a function that computes this based on weight parameter (w) and model weights (θ):
To obtain optimal weights, use the minimize method from Scipy:
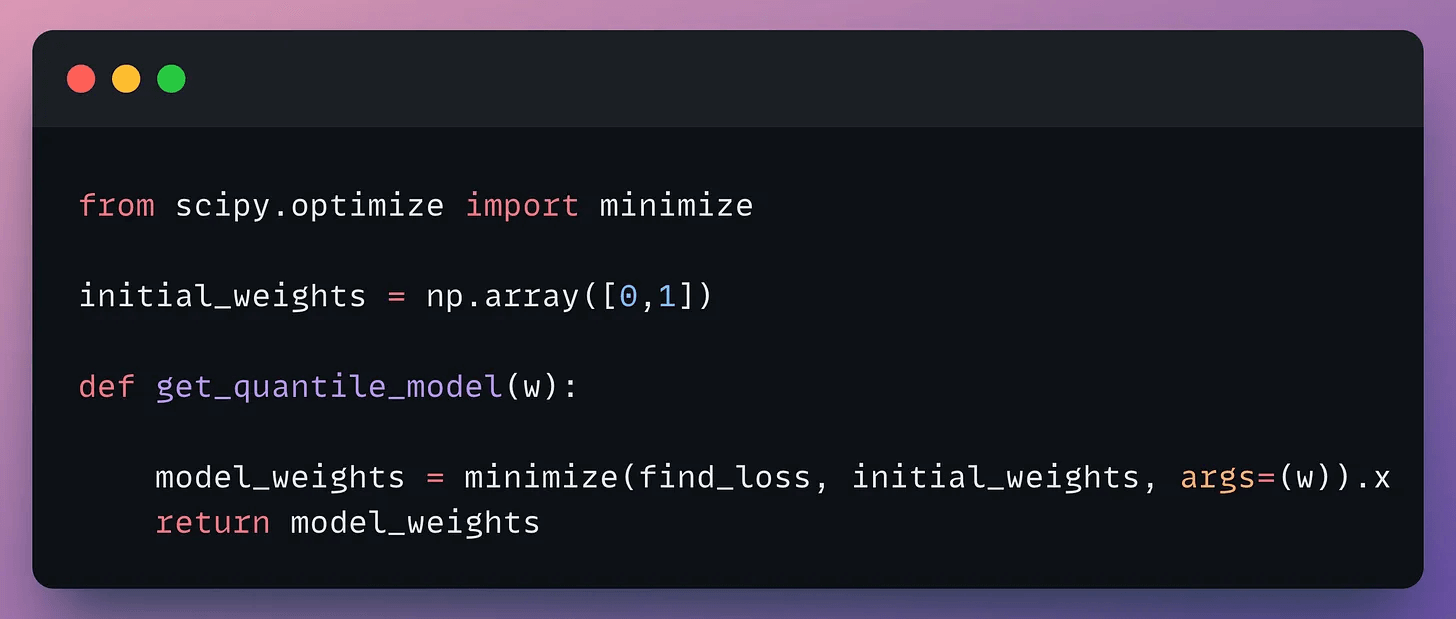
minimize() returns the parameter values that minimize the objective function.
Done!
Running for 5 different values of w:
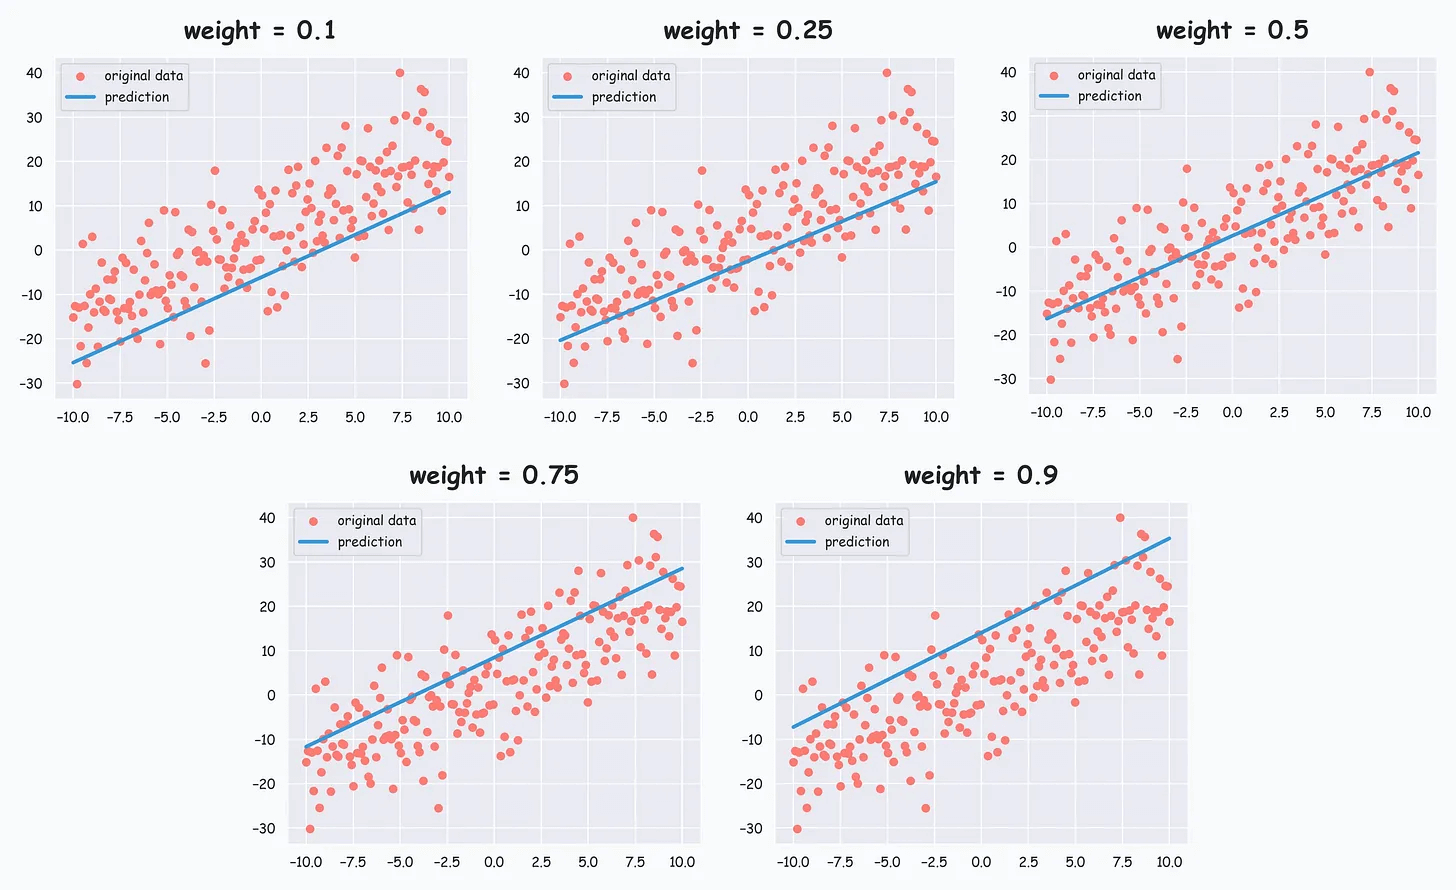
As w increases, the line moves upward toward higher quantiles, and this gives us quantile estimates as desired.
Quantile regression works particularly well with tree-based models. LightGBM regression, for instance, natively supports quantile objective functions.
👉 Over to you: Can you train a neural network with quantile loss? What would the procedure look like?
Thanks for reading!
P.S. For those wanting to develop “Industry ML” expertise:

At the end of the day, all businesses care about impact. That’s it!
Can you reduce costs?
Drive revenue?
Can you scale ML models?
Predict trends before they happen?
We have discussed several other topics (with implementations) that align with such topics.
Here are some of them:
Learn everything about MCPs in this crash course with 9 parts →
Learn how to build Agentic systems in a crash course with 14 parts.
Learn how to build real-world RAG apps and evaluate and scale them in this crash course.
Learn sophisticated graph architectures and how to train them on graph data.
So many real-world NLP systems rely on pairwise context scoring. Learn scalable approaches here.
Learn how to run large models on small devices using Quantization techniques.
Learn how to generate prediction intervals or sets with strong statistical guarantees for increasing trust using Conformal Predictions.
Learn how to identify causal relationships and answer business questions using causal inference in this crash course.
Learn how to scale and implement ML model training in this practical guide.
Learn techniques to reliably test new models in production.
Learn how to build privacy-first ML systems using Federated Learning.
Learn 6 techniques with implementation to compress ML models.
All these resources will help you cultivate key skills that businesses and companies care about the most.
Excellent analysis! What if the data distribution was multimodal or heavily skewed?