
Layers of Observability in AI Systems
...explained visually!

AI systems are becoming production software.
And production software needs observability.
Traditional software has had this figured out for decades. Distributed tracing, spans, and instrumentation are all standard practices now.
And AI systems are finally catching up.
So if you’re deploying LLM-powered apps to real users, you need to know what’s happening inside your pipeline at every step.
Here’s the mental model (see the attached diagram):
Think of your AI pipeline as a series of steps. For simplicity, let’s consider RAG.
A user asks a question, it flows through multiple components, and eventually, a response comes out.
Each of those steps takes time, each step can fail, and each step has its own cost. And if you’re only looking at the input and output of the entire system, you will never have full visibility.
This is where traces and spans come in.
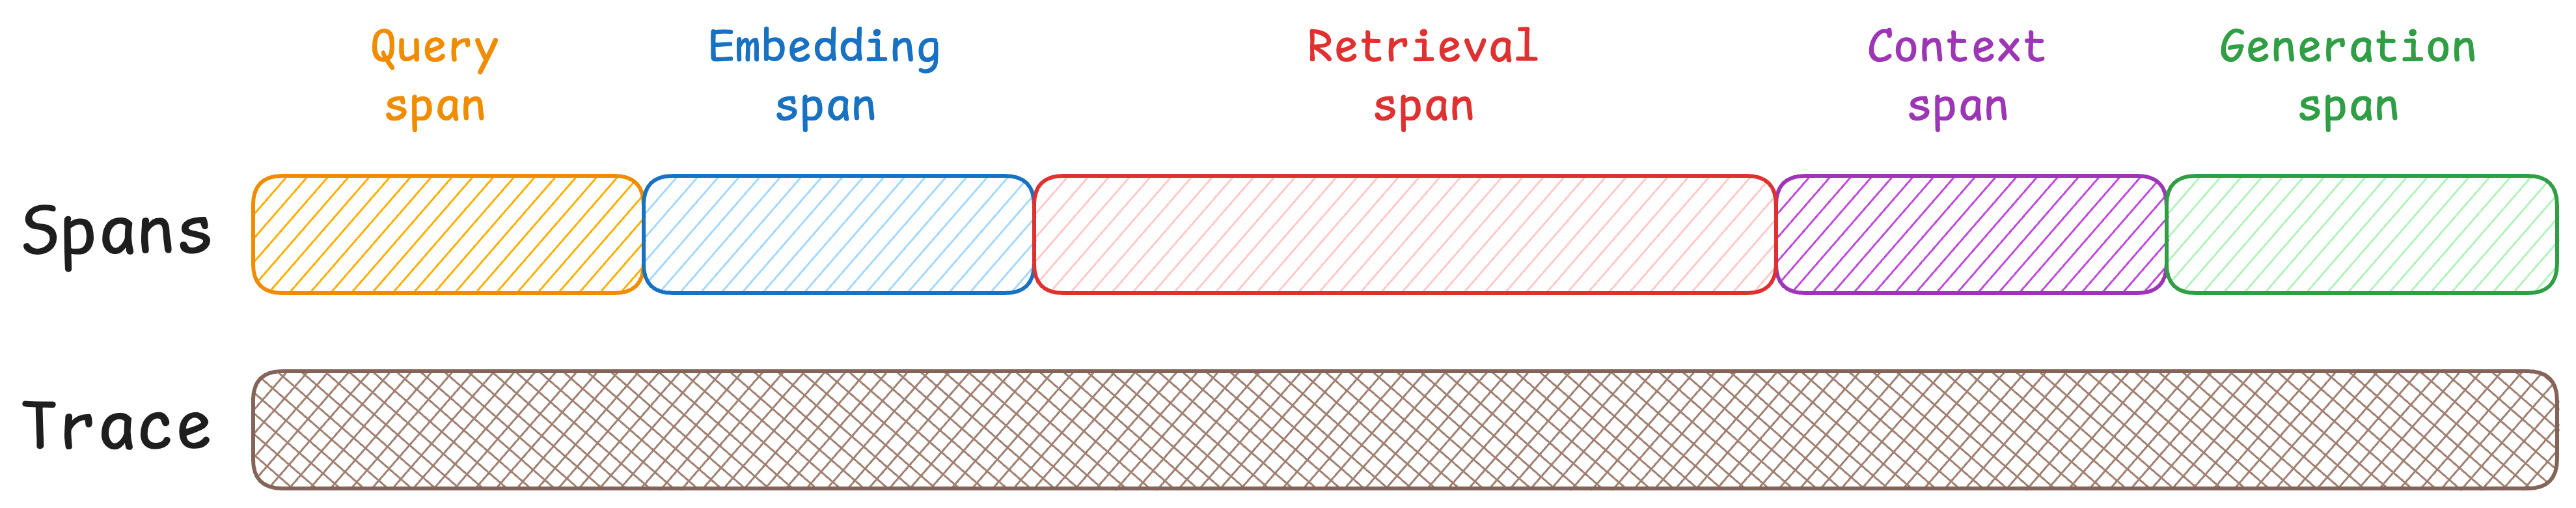
A Trace captures the entire journey, from the moment a user submits a query to when they get a response. Look at the "Trace" column in the diagram below. One continuous bar that encompasses everything.

Spans are the individual operations within that trace. Each colored box on the right represents a span.
Let’s understand what each span captures in this case:
Query span: User submits a question. This is where your trace begins. You capture the raw input, timestamp, and session info.
Embedding Span: The query hits the embedding model and becomes a vector. This span tracks token count and latency. If your embedding API is slow or hitting rate limits, you’ll catch it here.
Retrieval Span: The vector goes to your database for similarity search. Our observation suggests that this is where most RAG problems hide, with the most common reasons being bad chunks, low relevance scores, wrong
top-kvalues, etc. The retrieval span exposes all of it.Context Span: In this span, the retrieved chunks get assembled with your system prompt. This span shows you exactly what’s being fed to the LLM. So if the context is too long, you’ll see it here.
Generation Span: Finally, the LLM produces a response. This span is usually the longest and most expensive. Input tokens, output tokens, latency, reasoning (if any), etc., everything is logged for cost tracking and debugging.
This should make it clear that without span-level tracing, debugging is almost impossible.
You would just know that the response was bad, but you would never know if it was due to bad retrieval, bad context, or the LLM’s hallucination.
Cost tracking is another big one. Span-level tracking lets you see where the money is actually going.
One more thing: AI systems degrade over time. What worked last month might not work today. Span-level metrics let you catch drift early and tune each component independently.
Lastly, to clarify, a trace is the container that ties everything together for a single request. When a user submits a query, a unique Trace ID gets generated. Every span that happens as part of that request carries this same Trace ID.
So if your system processes 1000 queries, you have 1000 traces. Each trace contains multiple spans (embedding, retrieval, generation, etc.), but they’re all linked by that one Trace ID.
The “Trace” column shows one long continuous bar. That’s the trace - it starts when the query comes in and ends when the response goes out. All the colored spans on the right are nested inside it, linked by the same Trace ID.
Thanks for reading!