The Utility of ‘Variance’ in PCA for Dimensionality Reduction
Here's why using variance makes sense in PCA.
The core objective of PCA is to retain the maximum variance of the original data while reducing the dimensionality.
The rationale is that if we retain variance, we will retain maximum information.
But why?
Many people struggle to intuitively understand the motivation for using “variance” here.
In other words:
Why retaining maximum variance is an indicator for retaining maximum information?
Today, let me provide you an intuitive explanation of this.
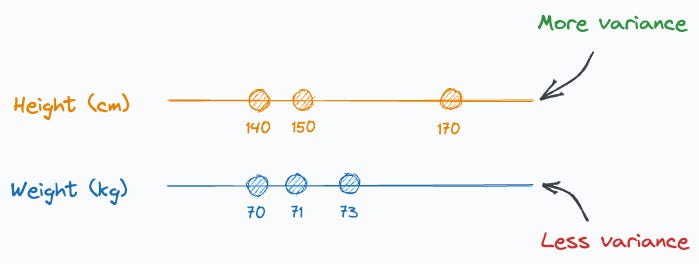
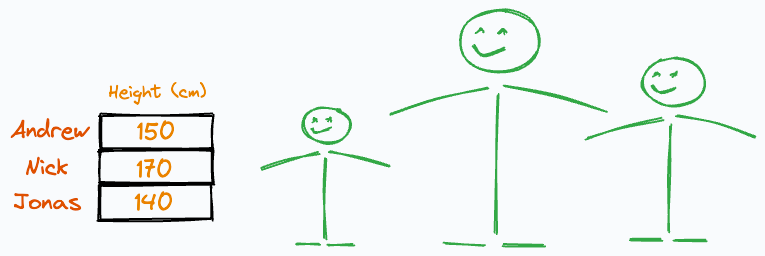
Imagine someone gave us the following weight and height information about three individuals:
It is easy to guess that the height column has more variation than weight, isn’t it?
Thus, even if we discard the weight column, we can still identify these people solely based on their heights.
The one in the middle is Nick.
The leftmost person is Jonas.
The rightmost one is Andrew.
That was super simple.
But what if we discarded the height column instead?
Can you identify them now?
No, right?
Why?
This is because their heights have more variation than their weights.
And it’s clear from the above example that, typically, if a column has more variation, it holds more information.
That is the core idea PCA is built around, and that is why it tries to retain maximum data variance.
Simply put, PCA was devised on the premise that more variance means more information.
Thus, during dimensionality reduction, we can (somewhat) say that we are retaining maximum information if we retain maximum variance.
Of course, as we are using variance, this also means that it can be easily influenced by outliers.
That is why we say that PCA is influenced by outliers.
I hope that the above explanation helped :)
As a concluding note, always remember that when using PCA, we don’t just measure column-wise variance and drop the columns with the least variance.
Instead, we must first transform the data to create uncorrelated features. After that, we drop the new features based on their variance.
If you wish to get into more detail, we mathematically formulated the entire PCA algorithm from scratch here: Formulating the Principal Component Analysis (PCA) Algorithm From Scratch.
The article covers:
The intuition and the motivation behind dimensionality reduction.
What are vector projections and how do they alter the mean and variance of the data?
What is the optimization step of PCA?
What are Lagrange Multipliers?
How are Lagrange Multipliers used in PCA optimization?
What is the final solution obtained by PCA?
Proving that the new features are indeed uncorrelated.
How to determine the number of components in PCA?
What are the advantages and disadvantages of PCA?
Key takeaway.
👉 Interested folks can read it here: Formulating the Principal Component Analysis (PCA) Algorithm From Scratch.
👉 Over to you: Could there be some other way of retaining “information” but not using variance as an indicator?
Thanks for reading!
Whenever you are ready, here’s one more way I can help you:
Every week, I publish 1-2 in-depth deep dives (typically 20+ mins long). Here are some of the latest ones that you will surely like:
[FREE] A Beginner-friendly and Comprehensive Deep Dive on Vector Databases.
You Are Probably Building Inconsistent Classification Models Without Even Realizing
Why Sklearn’s Logistic Regression Has no Learning Rate Hyperparameter?
PyTorch Models Are Not Deployment-Friendly! Supercharge Them With TorchScript.
DBSCAN++: The Faster and Scalable Alternative to DBSCAN Clustering.
Federated Learning: A Critical Step Towards Privacy-Preserving Machine Learning.
You Cannot Build Large Data Projects Until You Learn Data Version Control!
To receive all full articles and support the Daily Dose of Data Science, consider subscribing:
👉 If you love reading this newsletter, feel free to share it with friends!
👉 Tell the world what makes this newsletter special for you by leaving a review here :)


