Use Box Plots with Caution! They Can Be Misleading.
They can be misleading.
Box plots are pretty common in data analysis.
Yet, they can be highly misleading at times.
Let’s understand how!
To begin, a box plot is a graphical representation of just five numbers:
min
first quartile
median
third quartile
max
This means that if two entirely different distributions have similar five values, they will produce identical box plots, as depicted below:
As depicted above, three datasets have the same box plots, but entirely different distributions.
This shows that solely looking at a bar plot may lead to incorrect or misleading conclusions.
Here, the takeaway is not that box plots should not be used.
Instead, the takeaway is that whenever we generate any summary statistic, we lose essential information.
Thus, always look at the underlying data distribution.
For instance, whenever I create a box plot, I create a violin (or KDE) plot too. This lets me validate whether summary statistics resonate with the data distribution.
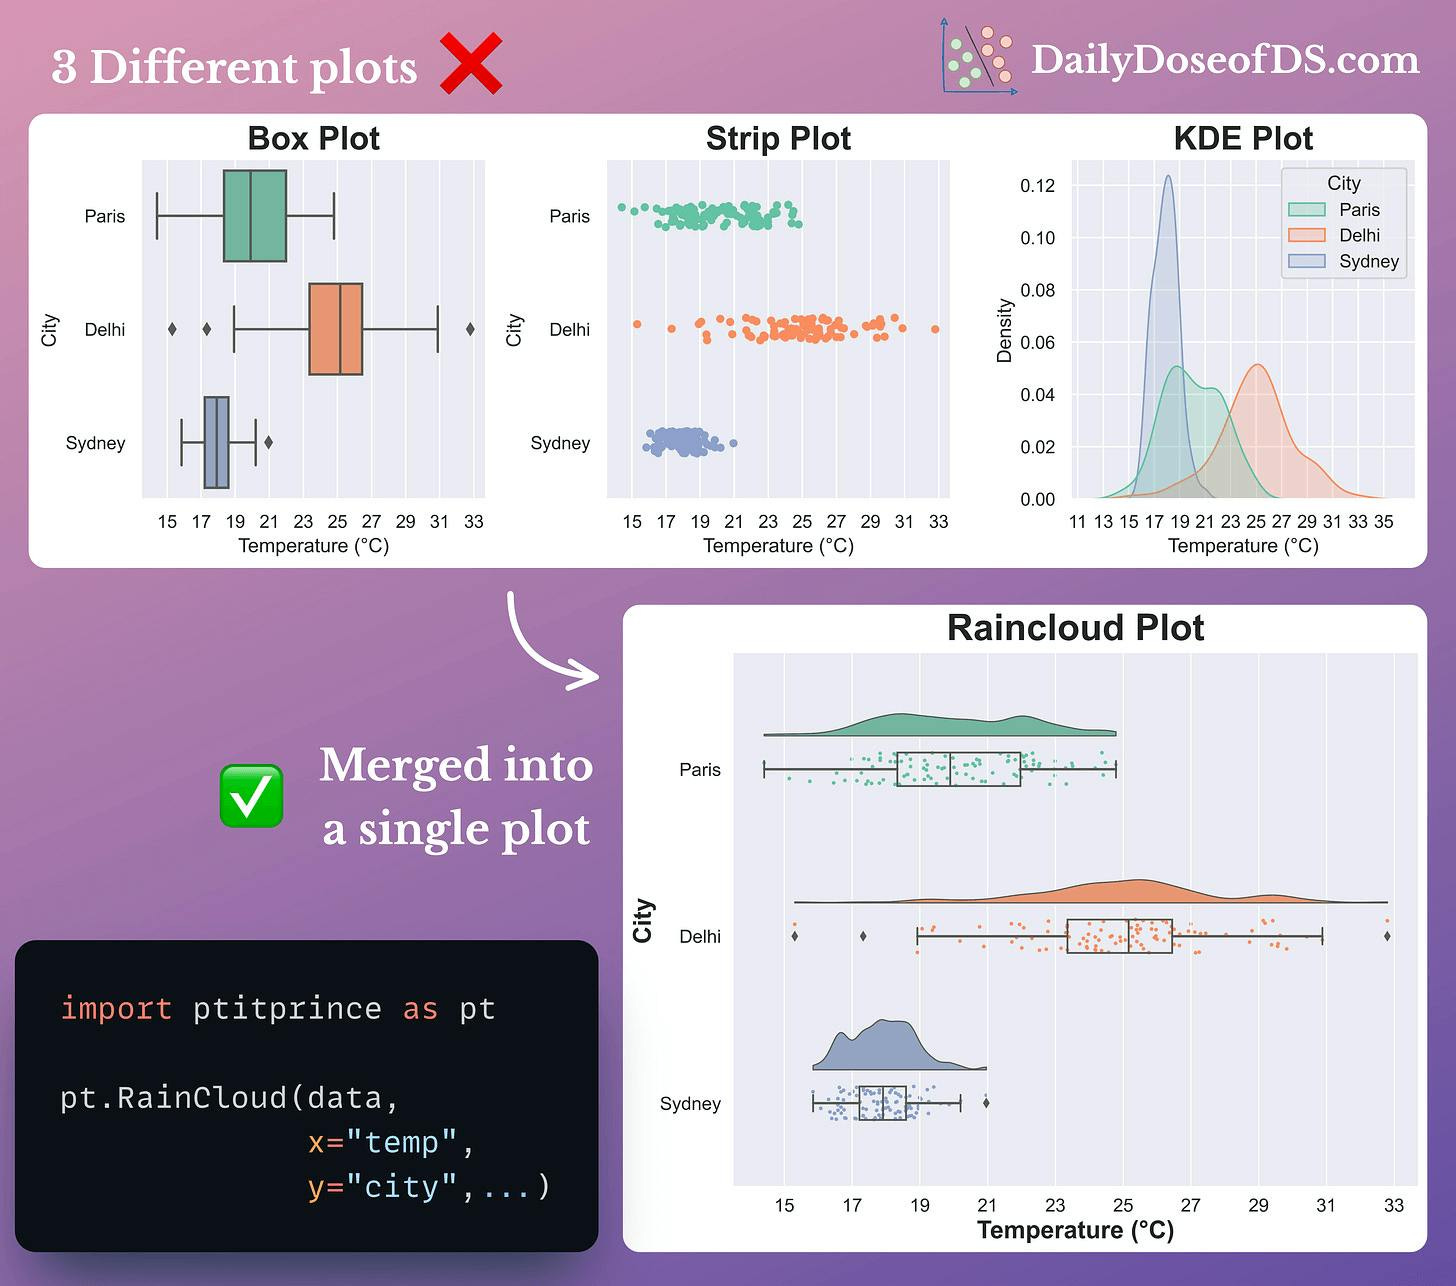
In fact, I also find Raincloud plots to be pretty useful.
They provide a pretty concise way to combine and visualize three different types of plots together:
Box plots for data statistics.
Strip plots for data overview.
KDE plots for the probability distribution of data.
Impressive, isn't it?
That said…
Building end-to-end projects has taught me MANY invaluable technical lessons and cautionary measures, which I hardly found anyone talking about explicitly.
I covered 8 more pitfalls and cautionary measures here: 8 Fatal (Yet Non-obvious) Pitfalls and Cautionary Measures in Data Science.
Moreover, I have seen that many ML engineers quickly pivot to building a different model when they don't get satisfying results with one kind of model.
They do not fully exploit the possibilities of existing models and continue to move towards complex ones.
However, after building so many ML models, I have learned various techniques that uncover nuances and optimizations we could apply to significantly enhance model performance without necessarily increasing the model complexity.
I shared 11 such high-utility techniques here: 11 Powerful Techniques To Supercharge Your ML Models.
👉 Over to you: What other measures do you take when using summary statistics?
P.S. For those wanting to develop “Industry ML” expertise:
We have discussed several other topics (with implementations) in the past that align with such topics.
Here are some of them:
Learn sophisticated graph architectures and how to train them on graph data: A Crash Course on Graph Neural Networks – Part 1
Learn techniques to run large models on small devices: Quantization: Optimize ML Models to Run Them on Tiny Hardware
Learn how to generate prediction intervals or sets with strong statistical guarantees for increasing trust: Conformal Predictions: Build Confidence in Your ML Model’s Predictions.
Learn how to identify causal relationships and answer business questions: A Crash Course on Causality – Part 1
Learn how to scale ML model training: A Practical Guide to Scaling ML Model Training.
Learn techniques to reliably roll out new models in production: 5 Must-Know Ways to Test ML Models in Production (Implementation Included)
Learn how to build privacy-first ML systems: Federated Learning: A Critical Step Towards Privacy-Preserving Machine Learning.
Learn how to compress ML models and reduce costs: Model Compression: A Critical Step Towards Efficient Machine Learning.
All these resources will help you cultivate key skills that businesses and companies care about the most.
SPONSOR US
Get your product in front of 450k+ data scientists and other tech professionals.
Our newsletter puts your products and services directly in front of an audience that matters — thousands of leaders, senior data scientists, machine learning engineers, data analysts, etc., who have influence over significant tech decisions and big purchases.
To ensure your product reaches this influential audience, reserve your space here or reply to this email to ensure your product reaches this influential audience.


