Visually Assess Linear Regression Performance
Assumption turned into performance validation.
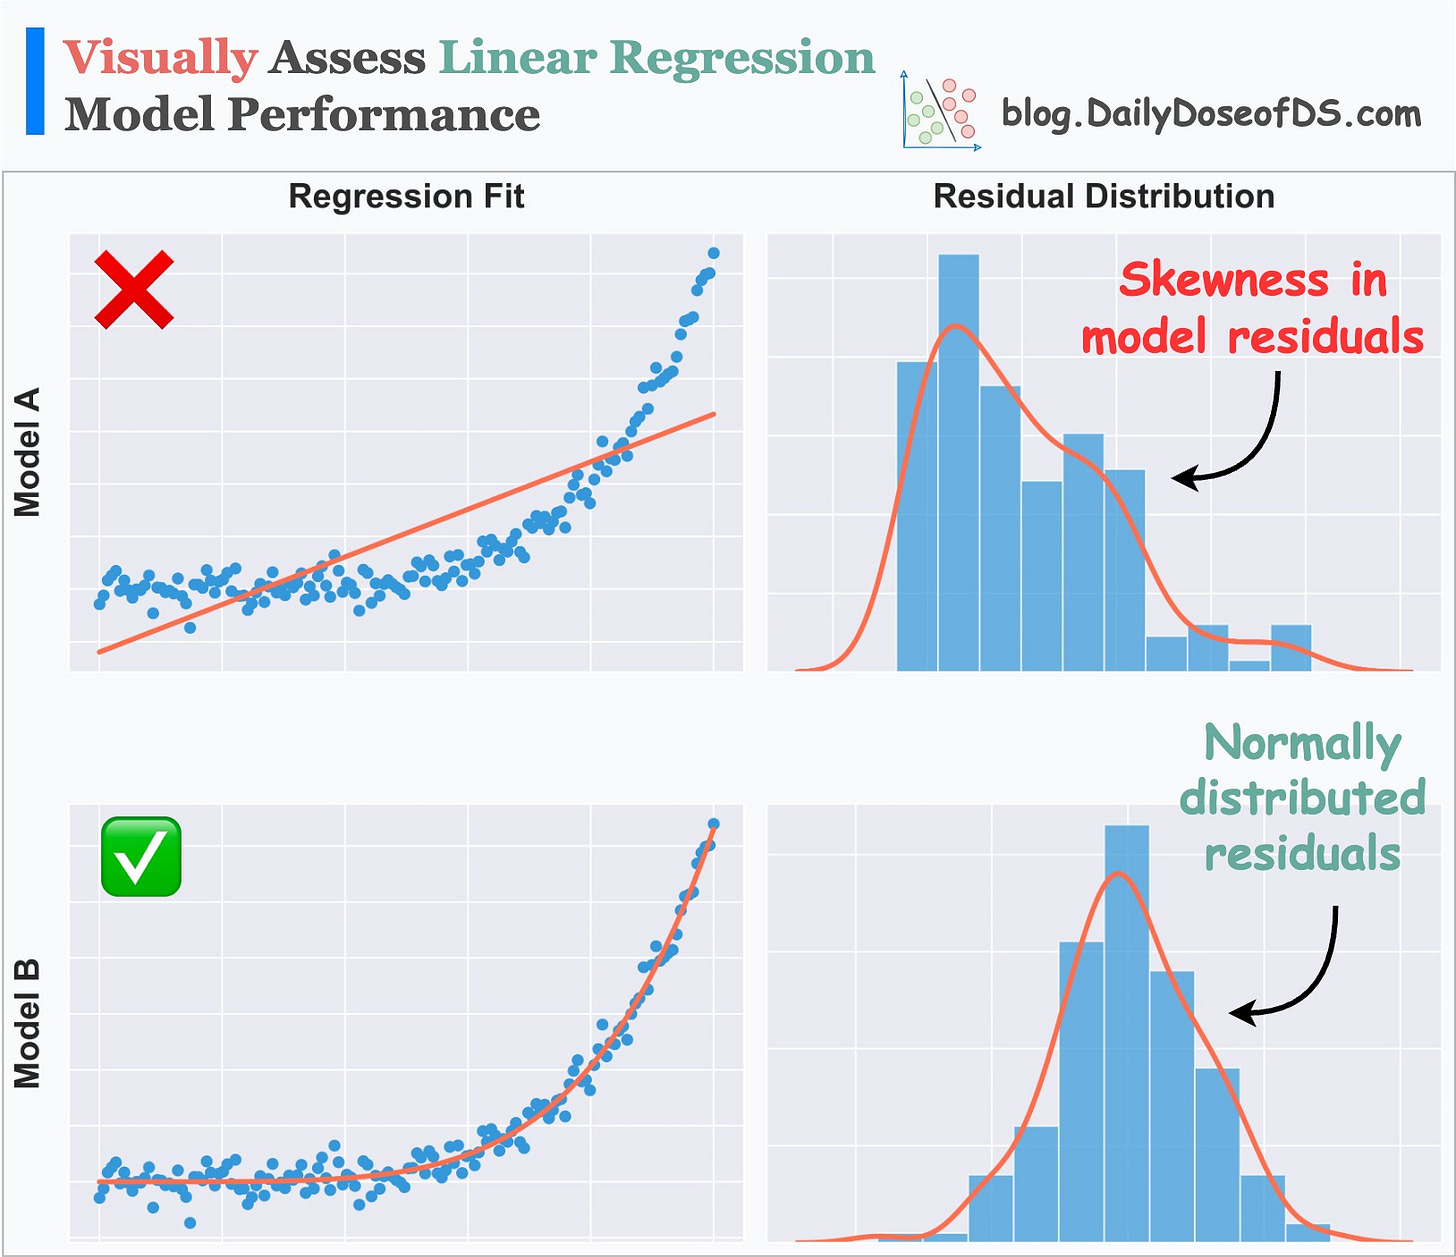
Linear regression assumes that the model residuals (=actual-predicted) are normally distributed.
If the model is underperforming, it may be due to a violation of this assumption.
Here, I often use a residual distribution plot to verify this and determine the model’s performance.
As the name suggests, this plot depicts the distribution of residuals (=actual-predicted), as shown below:
A good residual plot will:
Follow a normal distribution
NOT reveal trends in residuals
A bad residual plot will:
Show skewness
Reveal patterns in residuals
Thus, the more normally distributed the residual plot looks, the more confident we can be about our model.
This is especially useful when the regression line is difficult to visualize, i.e., in a high-dimensional dataset.
Why?
Because a residual distribution plot depicts the distribution of residuals, which is always one-dimensional.
Thus, it can be plotted and visualized easily.
Of course, this was just about validating one assumption — the normality of residuals.
However, linear regression relies on many other assumptions, which must be tested as well.
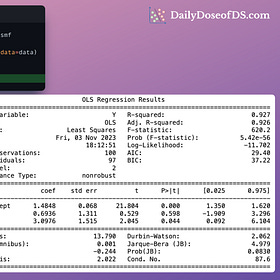
Statsmodel provides a pretty comprehensive report for this:
Read the following issue if you want to learn how to interpret this report:
Statsmodel Regression Summary Will Never Intimidate You Again
Statsmodel provides one of the most comprehensive summaries for regression analysis. Yet, I have seen so many people struggling to interpret the critical model details mentioned in this report. Today, let me help you understand the entire summary support provided by statsmodel and why it is so important.
And if you want to learn where the assumptions originate from, then read this deep dive.
👉 Over to you: What are some other ways/plots to determine the linear model’s performance?
Are you overwhelmed with the amount of information in ML/DS?
Every week, I publish no-fluff deep dives on topics that truly matter to your skills for ML/DS roles.
For instance:
A Beginner-friendly Introduction to Kolmogorov Arnold Networks (KANs).
5 Must-Know Ways to Test ML Models in Production (Implementation Included).
Understanding LoRA-derived Techniques for Optimal LLM Fine-tuning
8 Fatal (Yet Non-obvious) Pitfalls and Cautionary Measures in Data Science
Implementing Parallelized CUDA Programs From Scratch Using CUDA Programming
You Are Probably Building Inconsistent Classification Models Without Even Realizing.
How To (Immensely) Optimize Your Machine Learning Development and Operations with MLflow.
And many many more.
Join below to unlock all full articles:
SPONSOR US
Get your product in front of 77,000 data scientists and other tech professionals.
Our newsletter puts your products and services directly in front of an audience that matters — thousands of leaders, senior data scientists, machine learning engineers, data analysts, etc., who have influence over significant tech decisions and big purchases.
To ensure your product reaches this influential audience, reserve your space here or reply to this email to ensure your product reaches this influential audience.


Thank you for this write up Avi Chawla, this is a neat metric to use for assessing the models