
What Makes Histograms a Misleading Choice for Data Visualisation?
...and here's how to prevent being misled by them.

Histograms are quite common in data analysis and visualisation.
Yet, they can be highly misleading at times.
Why?
Let’s understand today!
To begin, a histogram represents an aggregation of one-dimensional data points based on a specific bin width:

This means that setting different bin widths on the same dataset can generate entirely different histograms.
This is evident from the image below:
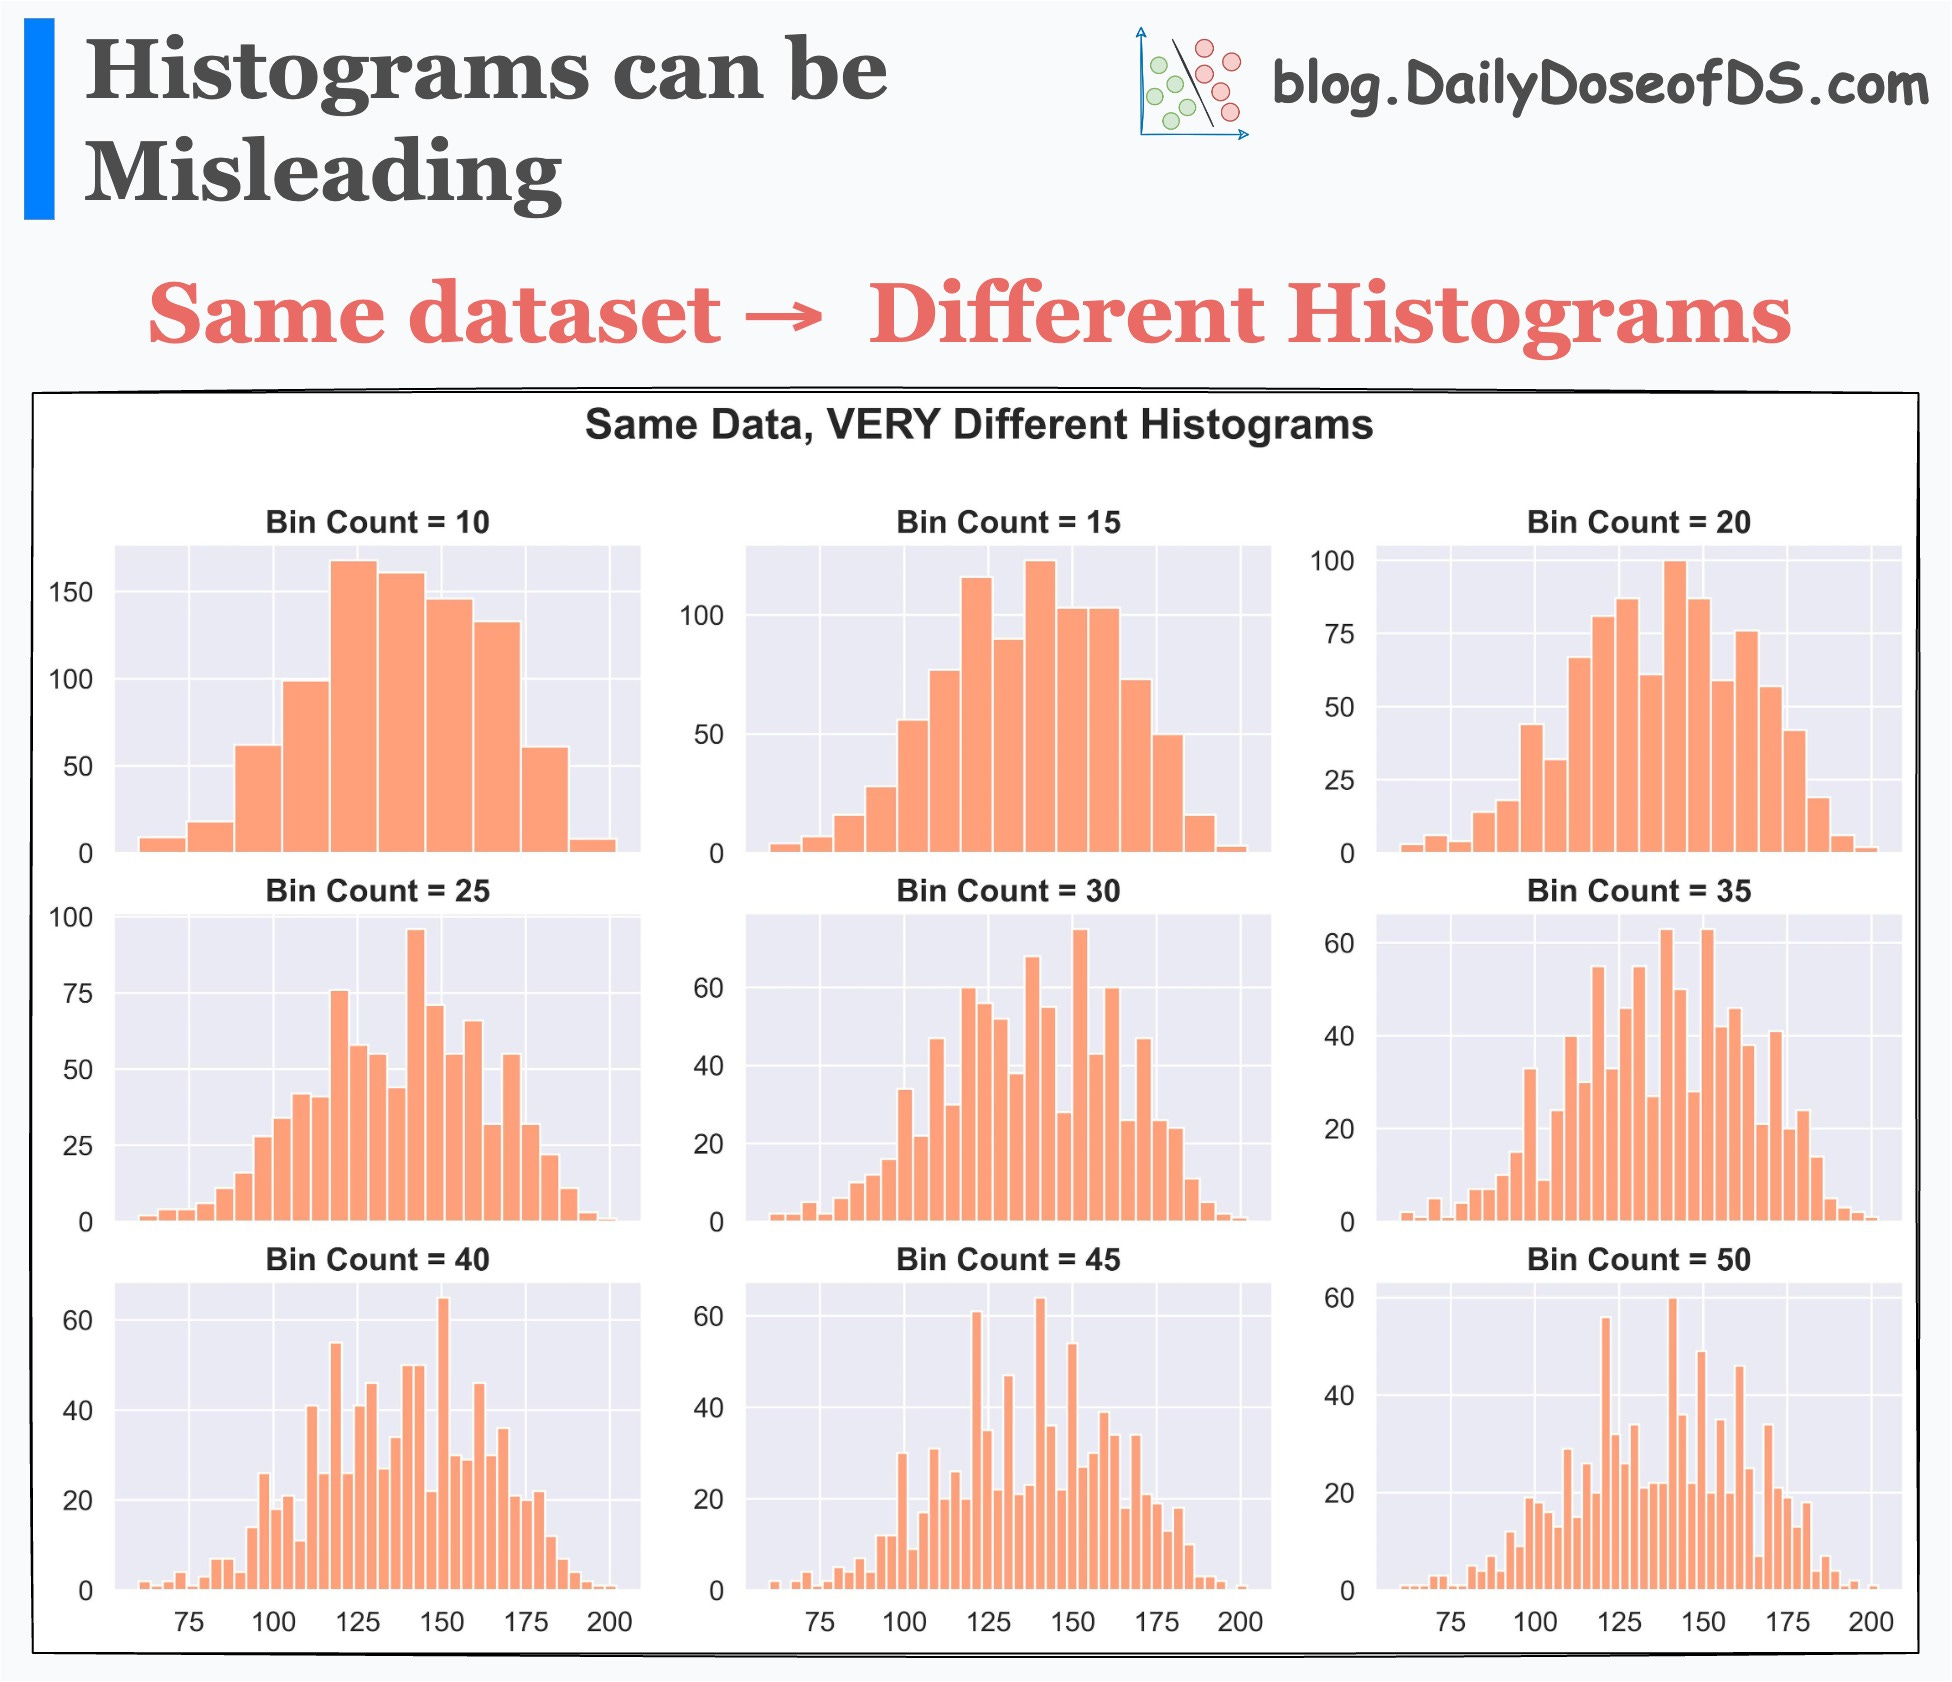
Each histogram conveys a different story, even though the underlying data is the same.
Thus, solely looking at a histogram to understand the data distribution may lead to incorrect or misleading conclusions.
Here, the takeaway is not that histograms should not be used. Instead, it’s similar to what we saw in one of the earlier posts about correlation:
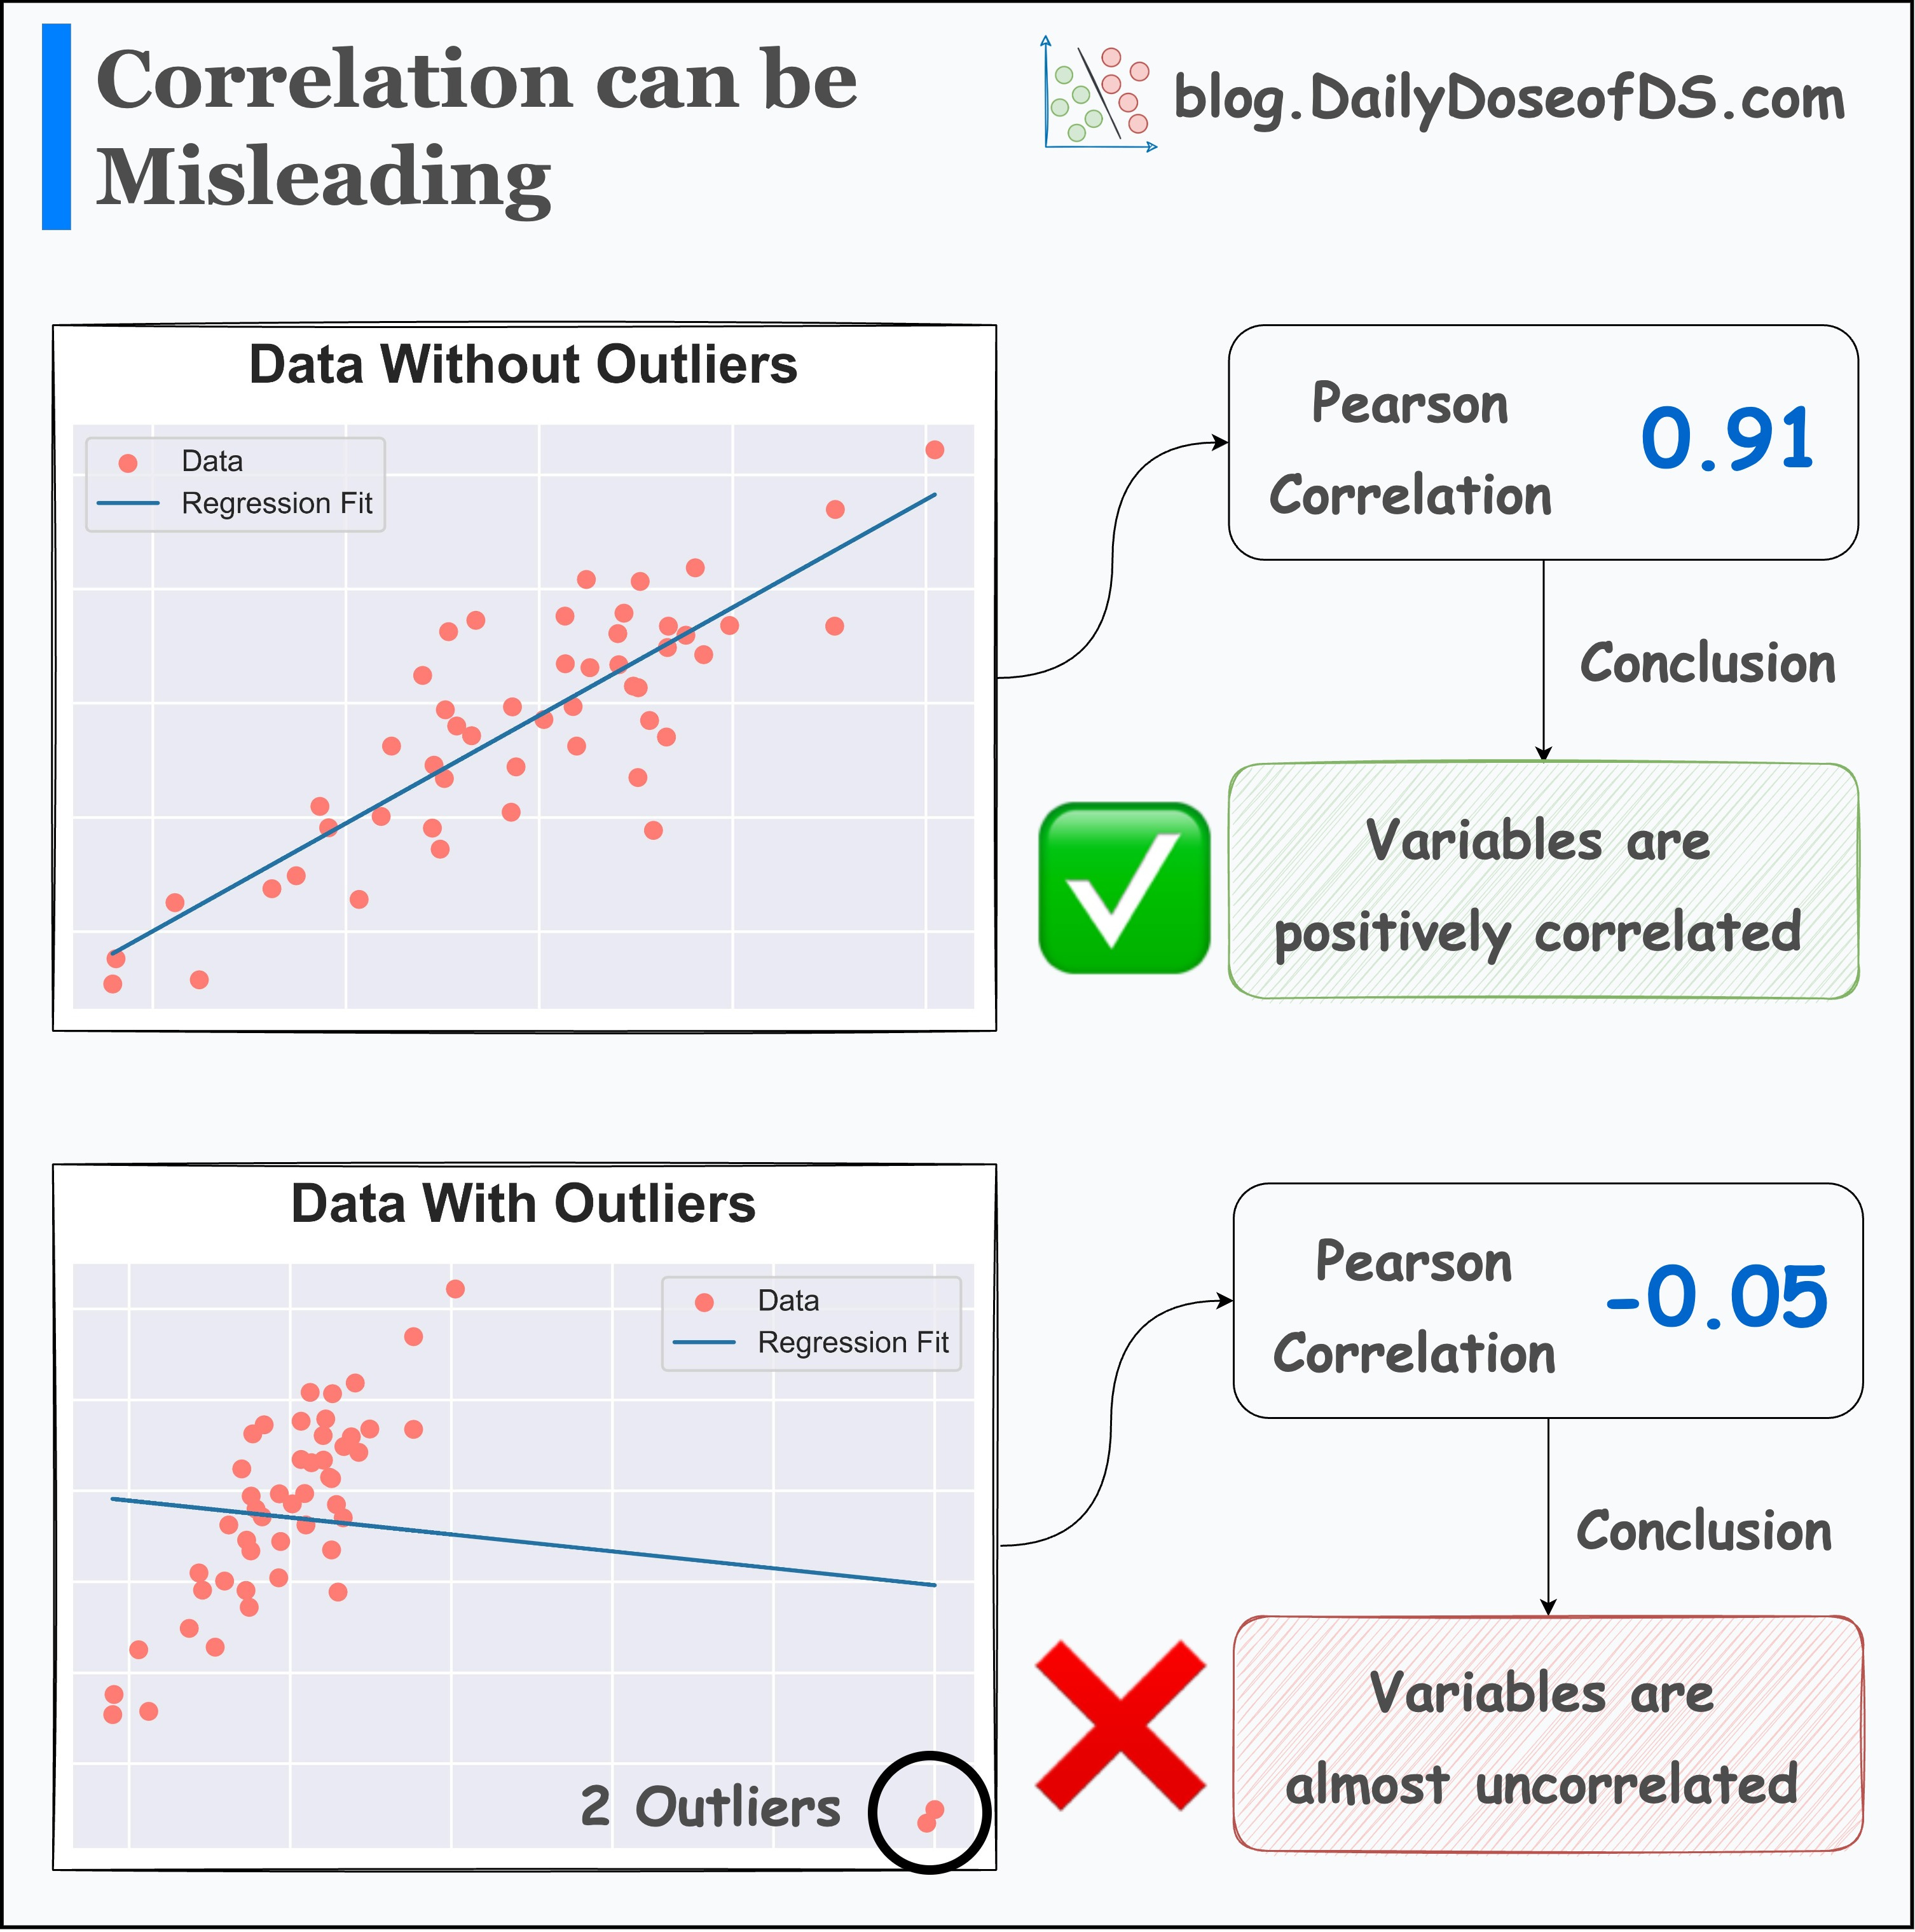
Whenever you generate any summary statistic, you lose essential information.
In our case, every bin of a histogram also represents a summary statistic — an aggregated count.

And whenever you generate any summary statistic, you lose essential information.
Thus, it is always important to look at the underlying data distribution.
For instance, to understand the data distribution, I prefer a violin (or KDE) plot. This gives me better clarity of data distribution over a histogram.

Visualizing density provides more information and clarity about the data distribution than a histogram.
👉 Over to you: What other measures do you take when using summary statistics?
👉 If you liked this post, don’t forget to leave a like ❤️. It helps more people discover this newsletter on Substack and tells me that you appreciate reading these daily insights. The button is located towards the bottom of this email.
Thanks for reading!
Latest full articles
If you’re not a full subscriber, here’s what you missed last month:
Why Bagging is So Ridiculously Effective At Variance Reduction?
Sklearn Models are Not Deployment Friendly! Supercharge Them With Tensor Computations.
Deploy, Version Control, and Manage ML Models Right From Your Jupyter Notebook with Modelbit
Model Compression: A Critical Step Towards Efficient Machine Learning.
Generalized Linear Models (GLMs): The Supercharged Linear Regression.
Gaussian Mixture Models (GMMs): The Flexible Twin of KMeans.
Formulating and Implementing the t-SNE Algorithm From Scratch.
To receive all full articles and support the Daily Dose of Data Science, consider subscribing:
👉 Tell the world what makes this newsletter special for you by leaving a review here :)
👉 If you love reading this newsletter, feel free to share it with friends!
Your point about histograms is entirely accurate, but I find it odd to recommend a KDE plot as an alternative as it has exactly the same issue except with “smoothing bandwidth” instead of “bin width”.
You made an excellent analogy of checking if a regression summery is likely to be accurate by using a scatter plot to check for outliers. Similarity, for this case I find it’s best to check if binning will be accurate using a CDF plot.
Like a scatter plot CDF has the advantage of being “full resolution” with no rounding or binning and showing ALL the data points, so it shows the texture of your underlying data much better. If it’s generally smooth over a range then it’s “safe” to generate a histogram/KDE of the data in that range. But if it has sudden jumps then that’s where you need to be aware that different bin width / bandwidths may show different stories.