

Catalog every AI asset type in one scan
AI enters a codebase as at least five distinct asset types.
External LLM APIs, MCP servers, agents, tool plugins, and datasets are each pulled in through a different mechanism.
A lockfile catches none of them. The API call lives in application code, the MCP server in a config, the dataset behind a loader script, so no single scan surface exists, and security teams end up tracking fragments.

Checkmarx AI Inventory (part of Checkmarx One) scans for all five in one pass and lists each with its provider, version, and exact file and line, exported as an AI-BOM for audits.
Gartner named Checkmarx a Leader in its inaugural Magic Quadrant for Software Supply Chain Security.
Learn more about Checkmarx AI Inventory here →
Thanks to Checkmarx for partnering today!
Why 86% of Claude Code bill has nothing to do with your prompts
You run a Claude Code session and ask it to build a simple Python utility. The session burns through millions of tokens. The Anthropic console shows the total, but it doesn’t show you where those tokens went.
You assume the cost is your prompts and the generated code. That assumption is wrong.
We traced a real Claude Code deployment across a 45-person engineering team over 30 days and broke down every token. Only 14% of input tokens were actual user prompts.
The rest was context that the developer never explicitly shared. Prior assistant context alone consumed 30-45% of the total input spend.
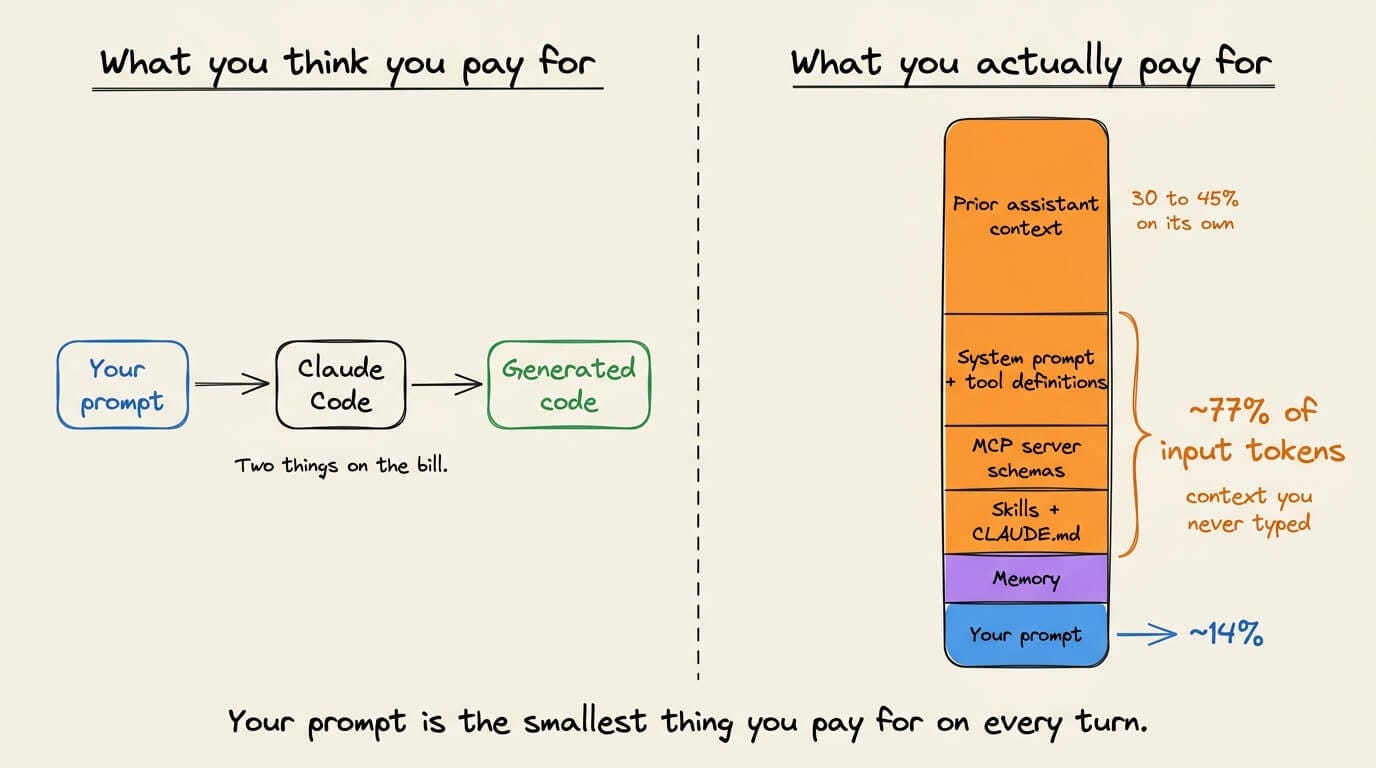
The scale of this problem is already visible in the industry right now.
Uber rolled Claude Code out to roughly 5,000 engineers and watched per-person bills climb to $500-$2,000 per month.
Another report of one developer on a $200 Max plan consumed $50,000 worth of tokens in a single month just by using the features as offered.
Claude Code has already crossed $1 billion in annualized revenue. The spend is real, but the visibility into what’s driving it is almost nonexistent for most teams.
The anatomy of a Claude Code session
Every Claude Code turn is a fresh API request.
The model doesn’t carry state between turns. Each message includes the full conversation history, the full tool schema, and every piece of context that’s been loaded into the session.
One thing to address upfront: Anthropic’s prompt caching does reduce the per-token price of replayed context to roughly 10% of the standard input rate. Claude Code is architecturally built around caching, and the cost figures throughout this article already account for it. Without caching, the picture would be dramatically worse. But caching reduces the price per token, not the volume of tokens being replayed. A bloated configuration still burns tokens on every turn, just at a discounted rate. The overhead is cheaper than it could be. It’s still overhead.
Here’s what that context stack looks like, broken down by where the tokens land.
Static overhead
Static overhead is the base system prompt, tool definitions, and behavioral instructions. It loads on every single turn, and you can’t configure it away.
In most individual setups without active cost management, it balloons significantly because the system prompt carries the weight of every tool definition, every MCP schema, and every behavioral instruction Claude Code needs to function.
These are fixed costs per turn that you pay regardless of what you’re working on.
Skills and CLAUDE.md
These are text files that give Claude Code domain-specific knowledge. They load into context based on glob patterns or always-on settings.
Most developers add them over time and rarely remove them. Skills that were useful for one project persist into the next, consuming tokens on every turn without contributing anything.
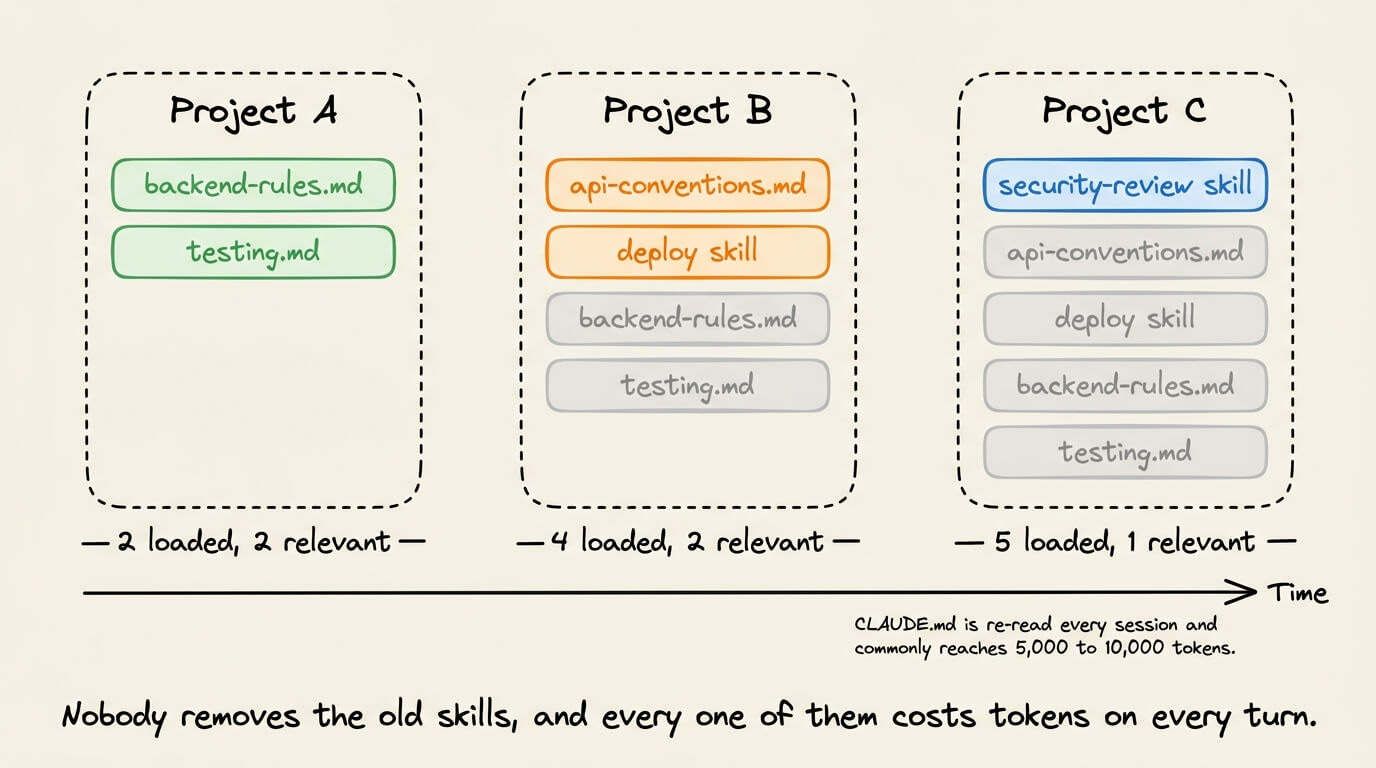
CLAUDE.md in particular is read at the start of every session, and every word in it costs tokens every time you send a message. Developers commonly accumulate CLAUDE.md files that grow to 5,000 or even 10,000 tokens.
There’s roughly a 10x cost difference between placing CLAUDE.md at the project root (where it gets injected into every tool call) versus in .claude/rules/ where it loads more selectively.
MCP server schemas
MCP server schemas are the tool definitions for every connected MCP server. Each server’s tools get serialized into a JSON blob describing every available tool, its purpose, and the shape of its inputs and outputs. That schema gets prepended to your context on every turn, not just once at session start.
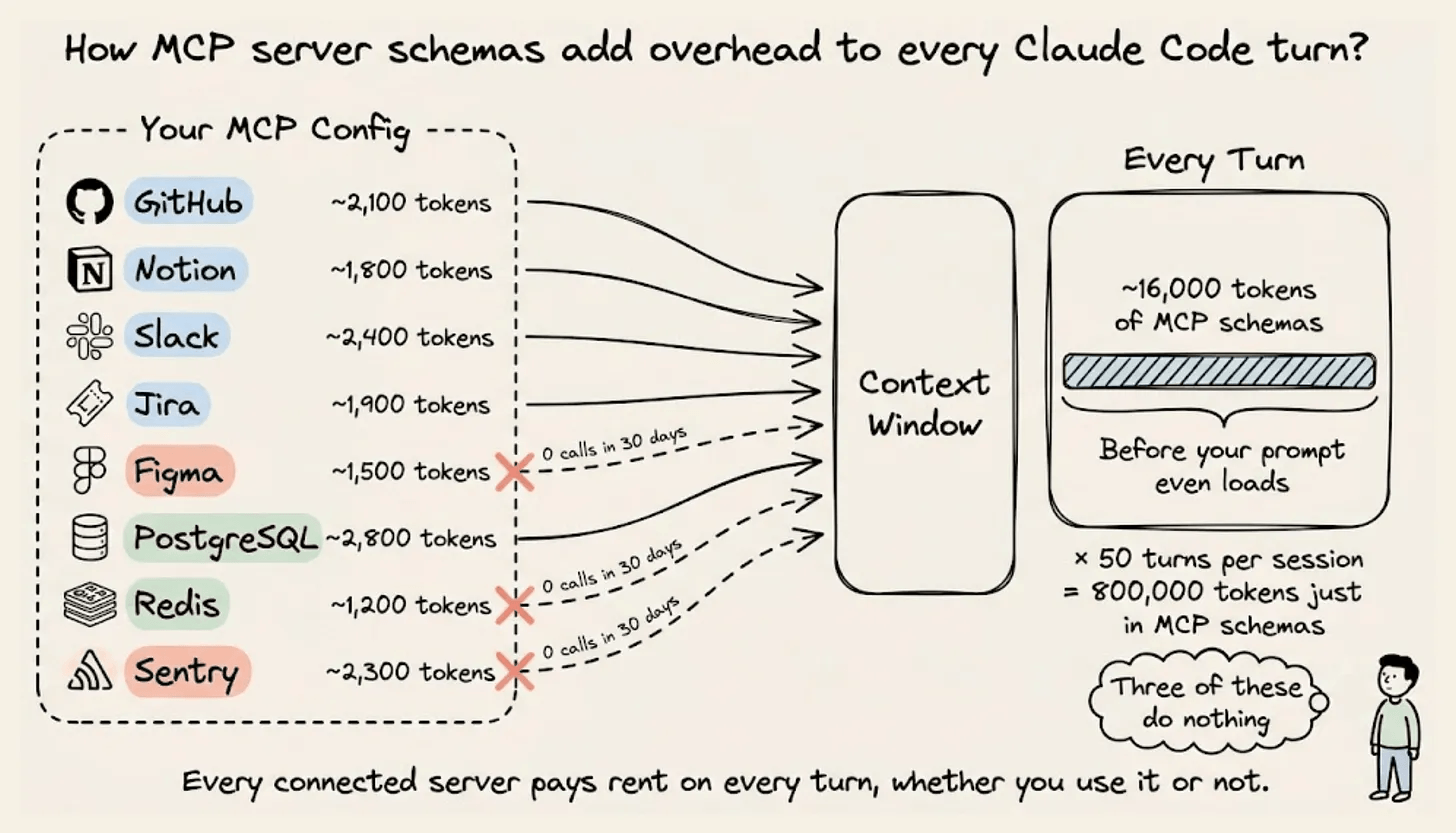
A developer with 10 MCP servers and 50 tools between them can pay up to 16,000 tokens per turn just in schema definitions. Every MCP you connect stays connected until you remove it manually. Most developers never do.
Tool results and built-in tool calls
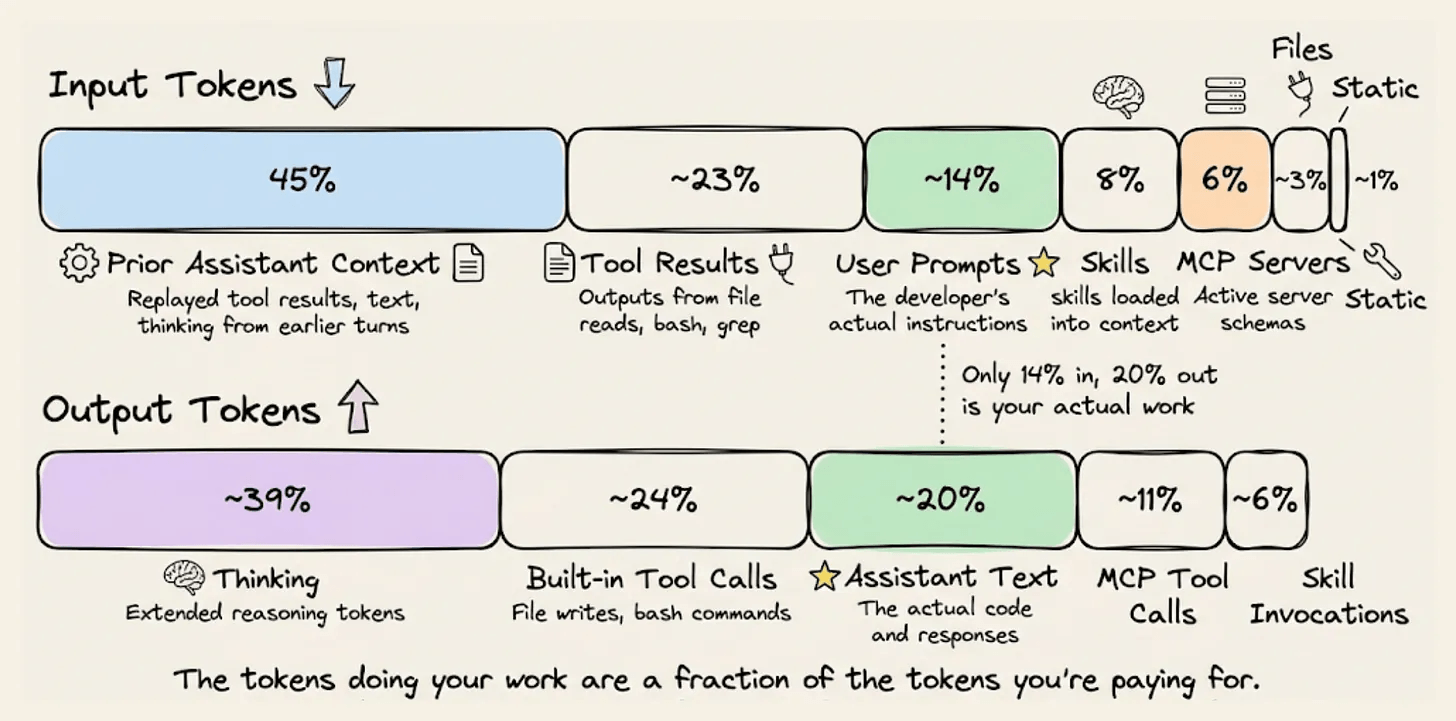
These sit on both sides of the token ledger. On the input side, tool results (outputs from file reads, bash commands, grep operations) account for 23% of input spend at enterprise scale. Every time Claude reads a file or runs a command, that output gets captured in the conversation history and replayed on subsequent turns.
On the output side, built-in tool calls (file writes, bash commands, code edits) consume 24% of output spend. These are the tokens Claude spends invoking tools rather than generating text you see.
Together, tool-related tokens make up the largest combined category in a typical session.
Prior assistant context
Simply put, this is the conversation history carried forward. Long sessions replay Claude’s own earlier thinking, text, and tool call results on every turn.
In a detailed breakdown of this category, 78% of prior assistant context cost came from replayed tool_use results, not the conversation text itself.
Previous tool outputs (file reads, grep results, bash commands) are the biggest replay tax, and they compound with every turn.
Thinking tokens
These are output tokens consumed by Claude’s reasoning process.
Until recently, Claude Code defaulted to “high” thinking effort on Opus. Developers on Reddit reported burning through Max limits 10x faster than on the previous model version.
Anthropic changed the default to “medium” after SWE-bench data showed 76% fewer output tokens at medium versus high with the same task completion rate.
At enterprise scale, Thinking can consume up to ~40% of total output spend.
Model selection
This is the silent multiplier behind all of this. Sonnet models cost roughly 0.6x what Opus costs per tier and performs comparably on most development work.
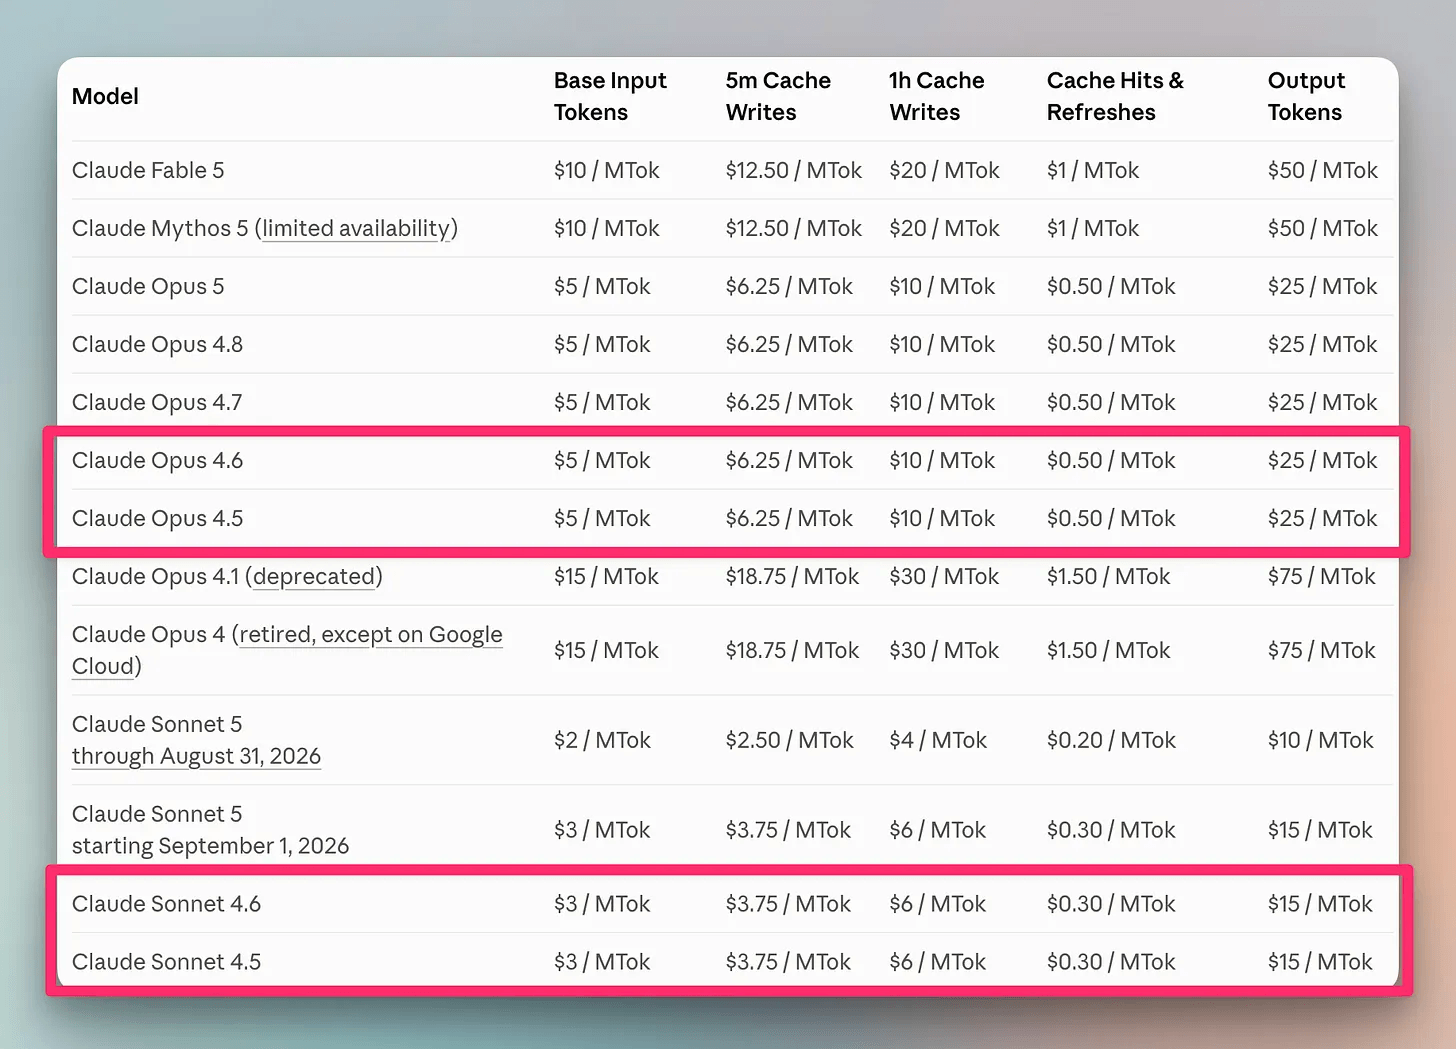
Running Opus by default for every task, including formatting, linting, and boilerplate generation, is one of the most expensive configuration choices a team can leave unexamined.
The visibility gap
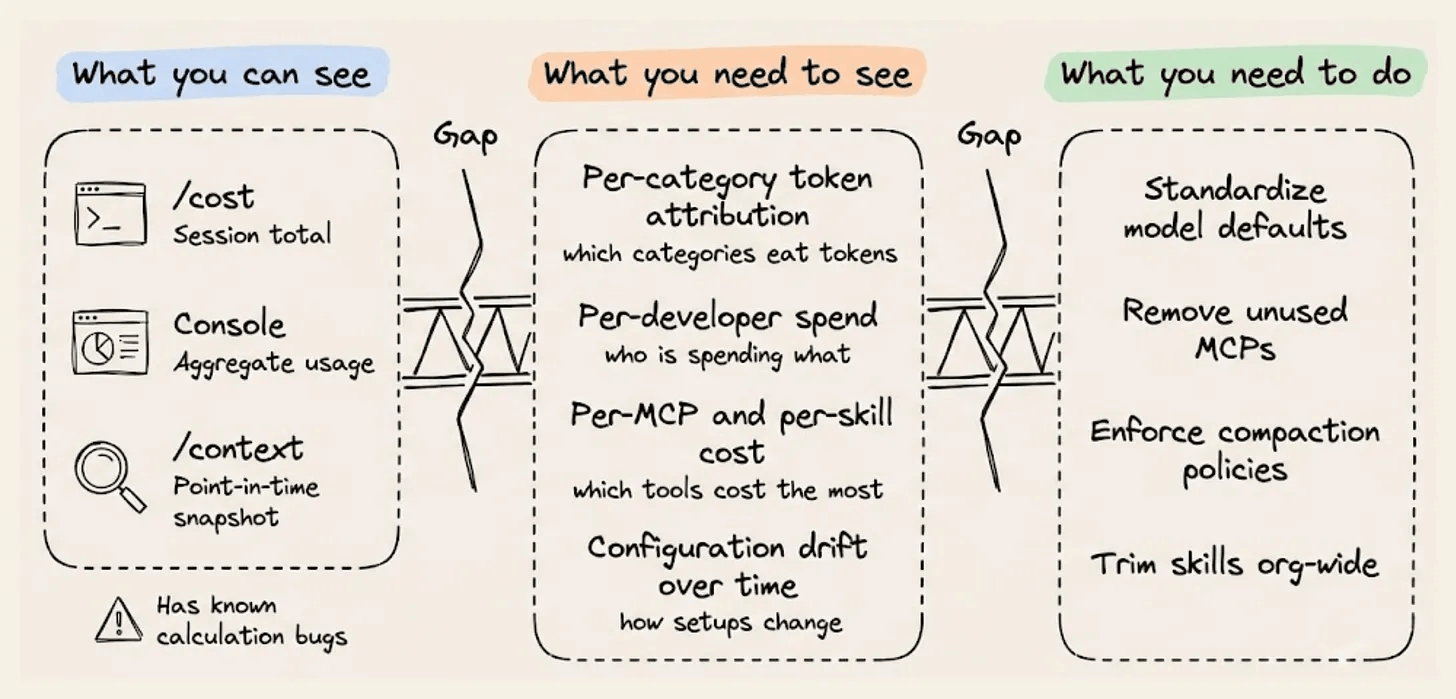
Developers currently have a limited number of options for understanding their Claude Code costs, and each one stops short.
The
/costcommand shows session-level totals. It tells you how much a session costs in aggregate, but it doesn’t tell you that 45% of your input spend was built into tool replays or that your MCP servers are adding thousands of tokens every turn.The Anthropic Console shows organization-level usage over time. It tells you the total tokens consumed across your workspace. If one team is burning tokens on MCPs they don’t need, the console shows a line going up. It doesn’t show why.
Claude Code’s
/contextcommand shows a snapshot of your current context window usage. It breaks down how much of the window is consumed by the system prompt, conversation history, and tool definitions. It doesn’t track patterns over time, compare across developers, or tell you which configuration elements are costing the most money. Worth noting that/contextalso has known calculation bugs and doesn’t always return accurate token counts, so even at the individual level the numbers aren’t always reliable.Manual auditing works for one person. You can check your system prompt size or inspect
.claude.jsonto count registered MCPs. But for an org with 50 or 100 developers, each with their own configurations, manual auditing breaks down. Configurations drift, MCPs accumulate and nobody removes anything because nobody knows what’s safe to remove.
The gap across all four is the same. None of them connect token attribution (which categories are eating tokens) to configuration policy (what should change) to implementation (applying changes across the team).
Those are three separate problems, and none of the built-in tools solves more than the first one partially.
What token-level observability looks like
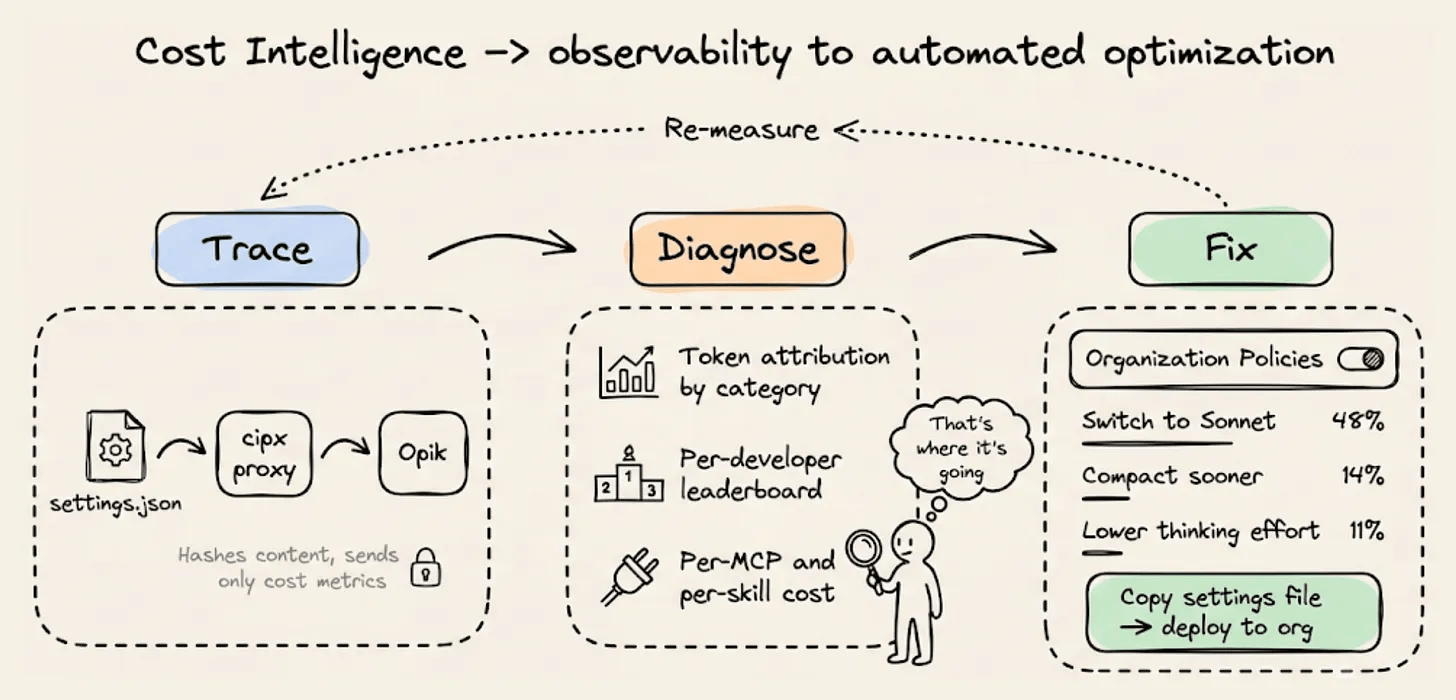
Comet built Cost Intelligence inside Opik to close that gap.
They built a proxy plugin that intercepts API traffic between Claude Code and the Anthropic API. It hashes content for privacy (your prompts and code are never stored or sent to Comet’s servers), extracts structural metadata like category, character count, and model, and sends only the cost metrics to Opik.
No SDK integration and code changes needed. Data appears after the first traced session.
The entire setup is a single config block in your Claude Code settings file.
{
  “enabledPlugins”: {
    “opik-cipx@opik-enterprise”: true
  },
  “env”: {
    “OPIK_CIPX_API_KEY”: “<workspace-scoped-api-key>”,
    “OPIK_CIPX_BASE_URL”: “https://www.comet.com/opik/api”,
    “OPIK_CIPX_PROJECT”: “claude-code”
  }
}
Once connected, the Home dashboard shows a Sankey diagram that maps every token from its source category through the coding agent to its output category.
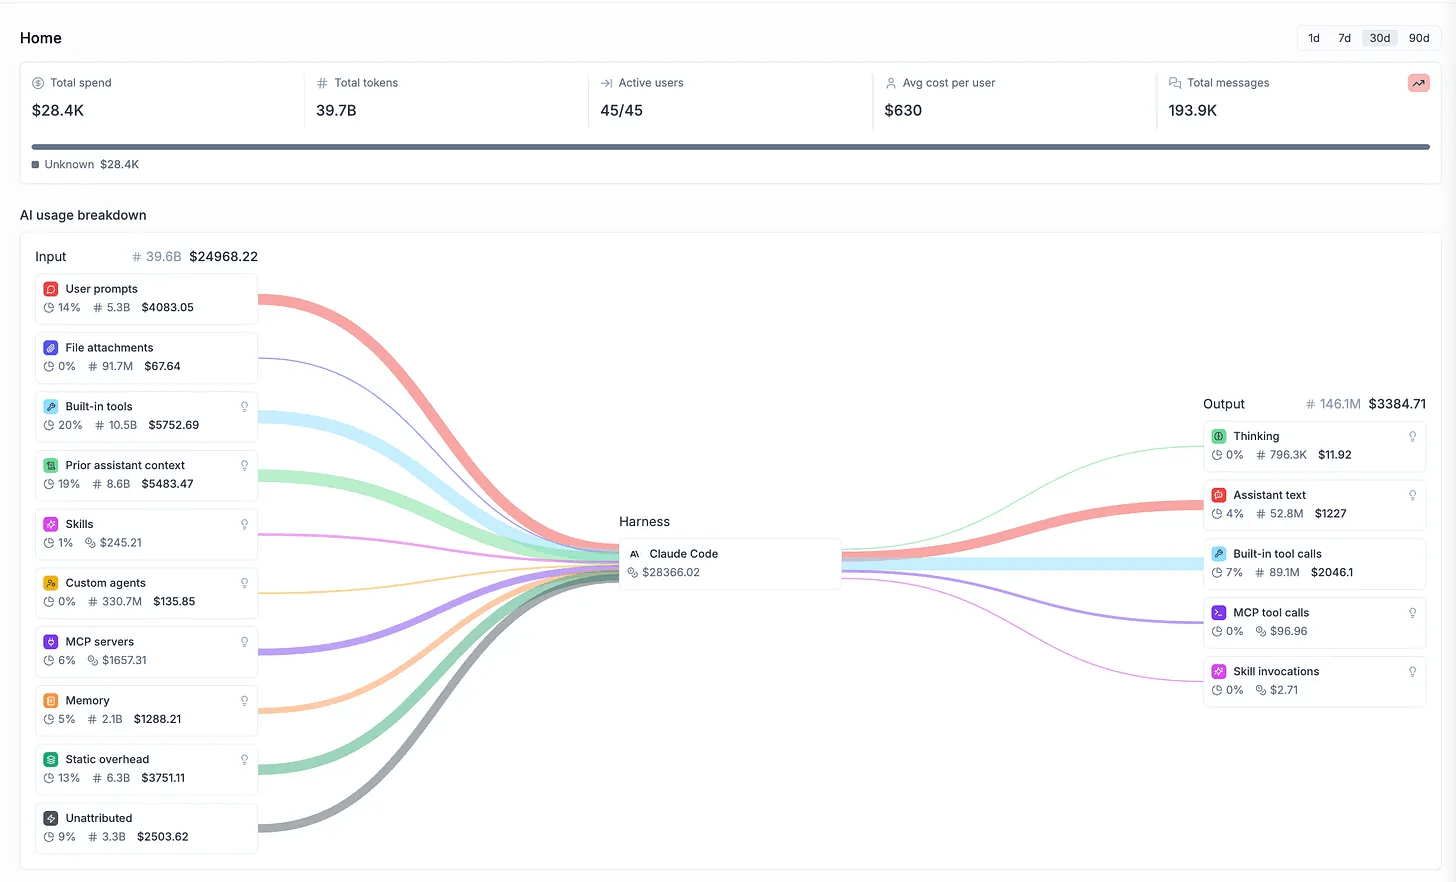
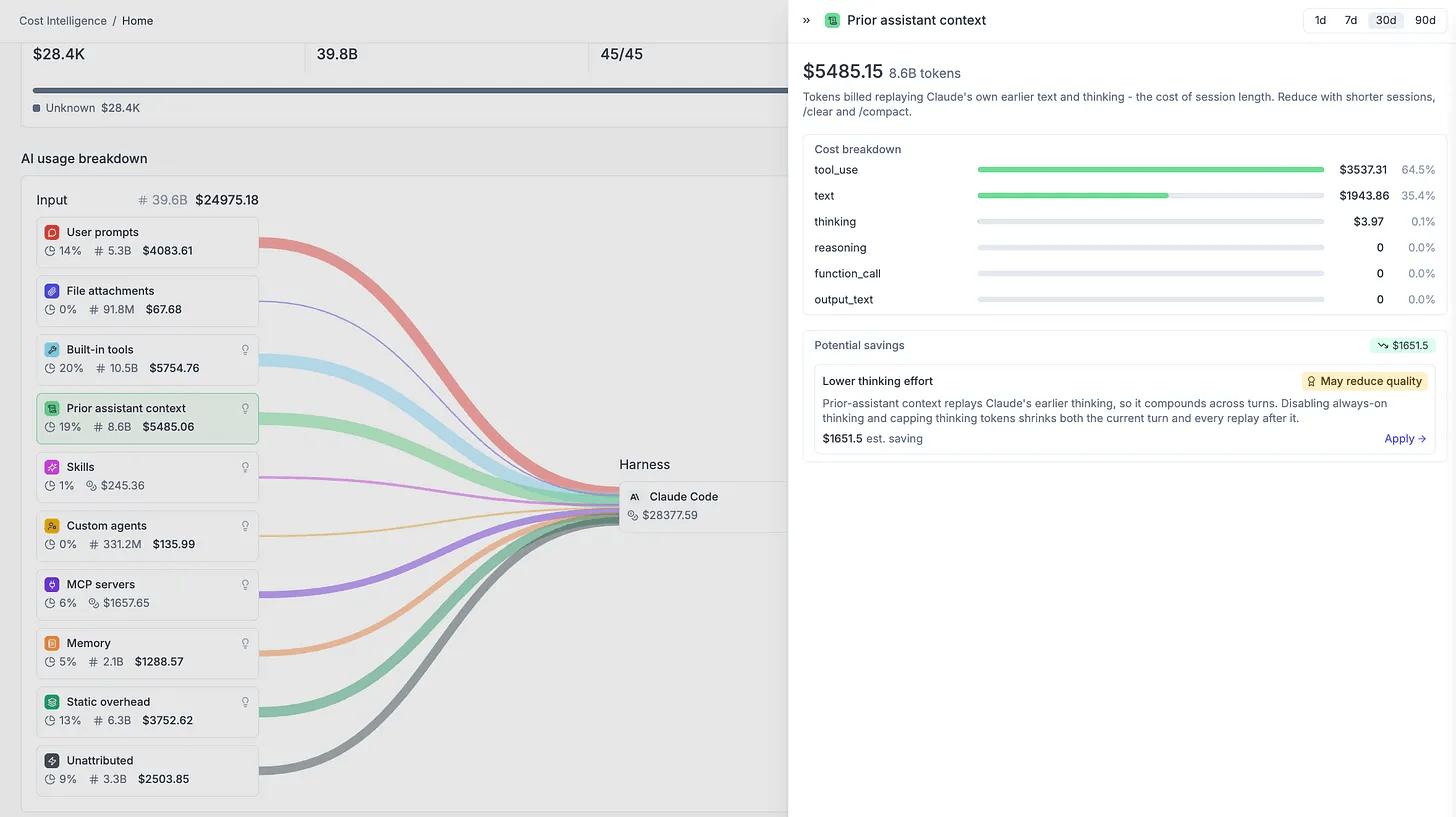
You can click into any category and see exactly what’s driving the cost. Clicking on Prior Assistant Context shows the cost split between replayed tool_use (64.5%), text (35.4%), and thinking (0.1%).
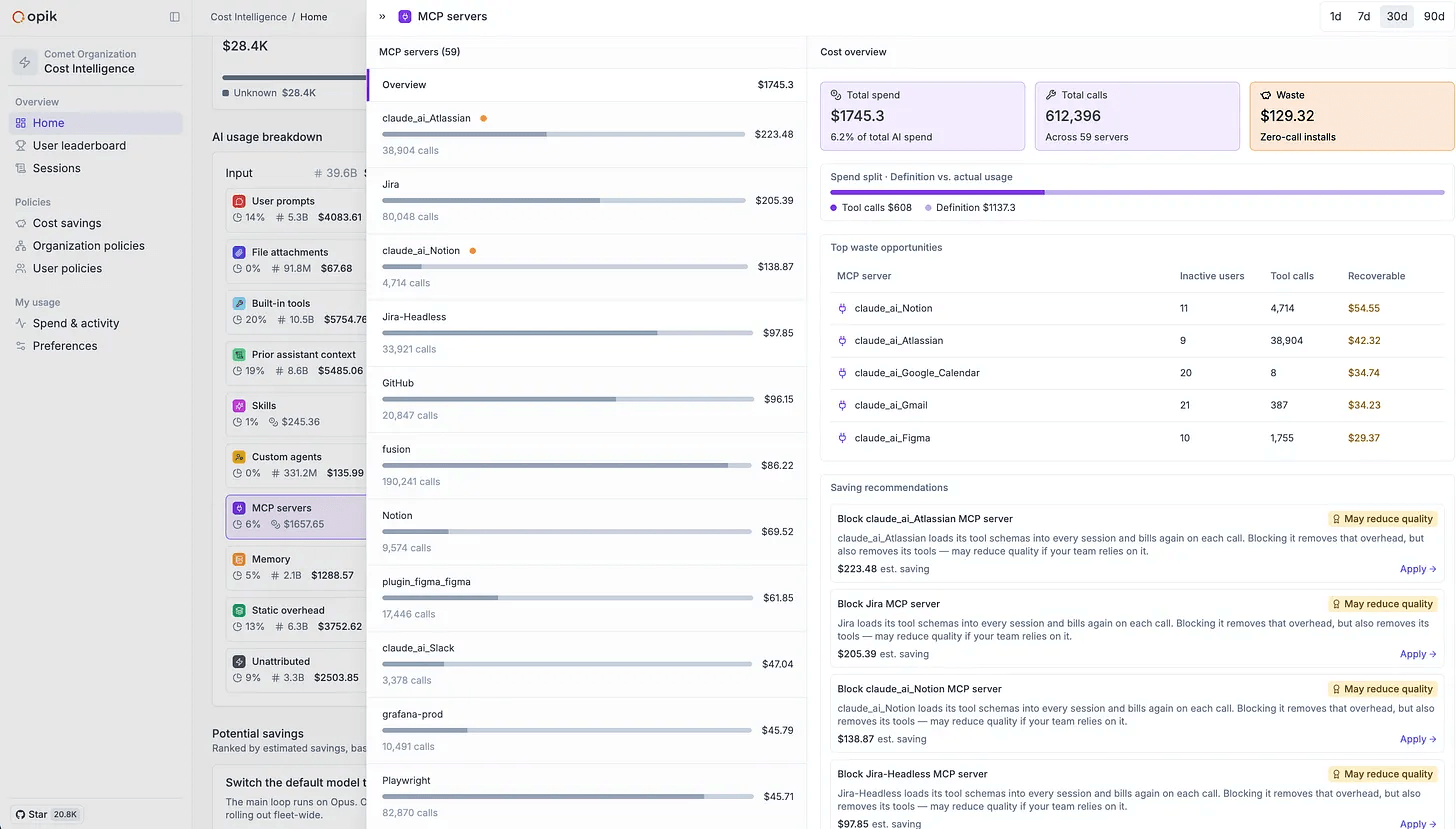
Click on MCP Servers, and you get a per-server ranked view showing total spend, call volume, and a “Waste” metric that flags servers with zero-call installs still loading their schemas every turn.
The User Leaderboard shows per-developer spend alongside their model choice, token consumption, skills count, MCPs count, and MCP call volume.
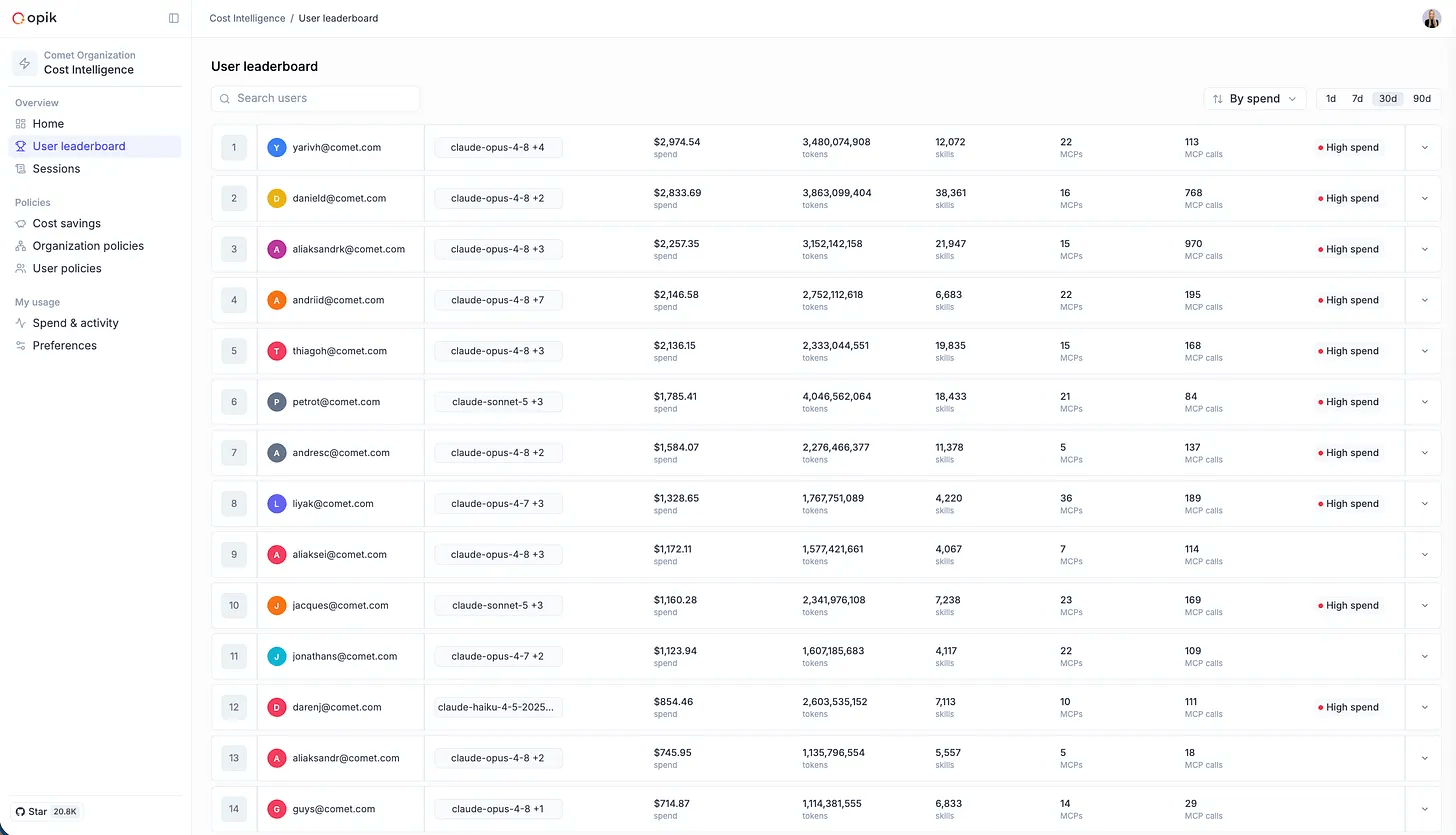
A “High spend” flag marks outlier users. This is the view that lets engineering leaders ask informed questions instead of enforcing blanket restrictions.
From visibility to fixes
The part that separates Cost Intelligence from a dashboard is the cost savings engine.
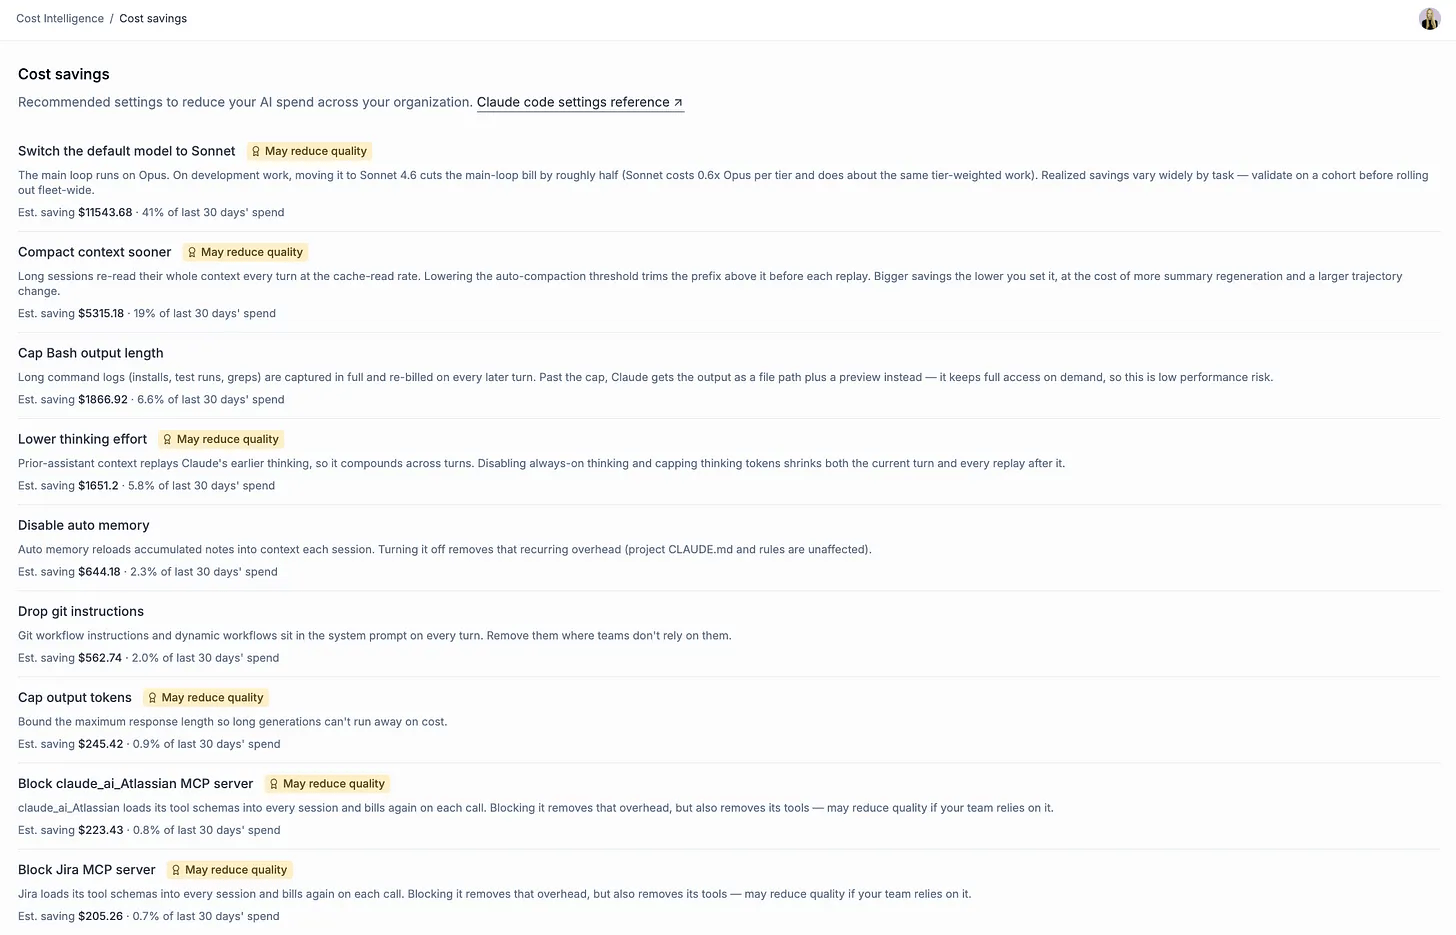
The Cost Savings page surfaces specific recommendations ranked by estimated savings, each with an explanation and a quality impact warning where relevant.
Here’s what those recommendations look like in practice.
Switch default model to Sonnet: On development work, moving to Sonnet cuts the main-loop bill by roughly half. Sonnet costs 0.6x Opus per tier and handles the same tier-weighted work. Estimated savings can vary from 22% upto 48% of total spend.
Compact context sooner: Long sessions re-read their whole context every turn at the cache-read rate. Lowering the auto-compaction threshold trims the prefix before each replay. Estimated savings can be 10-15% of spend.
Lower thinking effort: Prior-assistant context replays Claude’s earlier thinking, so it compounds across turns. Disabling always-on thinking and capping thinking tokens shrinks both the current turn and every replay after it. Estimated saving of 6-7%.
Block specific MCP servers. Cost Intelligence identifies servers with high inactive user counts, flags zero-call installs that still load schemas every session, and calculates recoverable spend per server.
Cap output tokens. Bounds the maximum response length so long generations can’t run away on cost. This prevents those sessions where Claude produces thousands of lines of code you didn’t ask for, each of which gets replayed on subsequent turns.
Disable auto memory. Auto memory reloads accumulated notes into context each session. Turning it off removes that recurring overhead while keeping project CLAUDE.md and rules unaffected.
Drop git instructions: Git workflow instructions sit in the system prompt on every turn. Remove them where teams don’t rely on them.
Each recommendation comes with an “Apply” button that implements the configuration change directly.
For org-wide deployment, the settings export generates a managed-settings.json that enforces all enabled policies across the team.
Comet’s internal engineering team ran this same exercise on their own Claude Code usage before building it into a product. They traced cost patterns back to specific prompt structures, context buildup, and workflow behaviors using Opik.
After refactoring their configuration (centralizing rules, migrating always-on skills to on-demand, adopting short session loops), their median output cost dropped from $229 to $181 per million output tokens. That’s a 21% reduction with zero change in development velocity.
A 15-minute audit you can run today
You can audit your own setup right now. Here’s where to look.
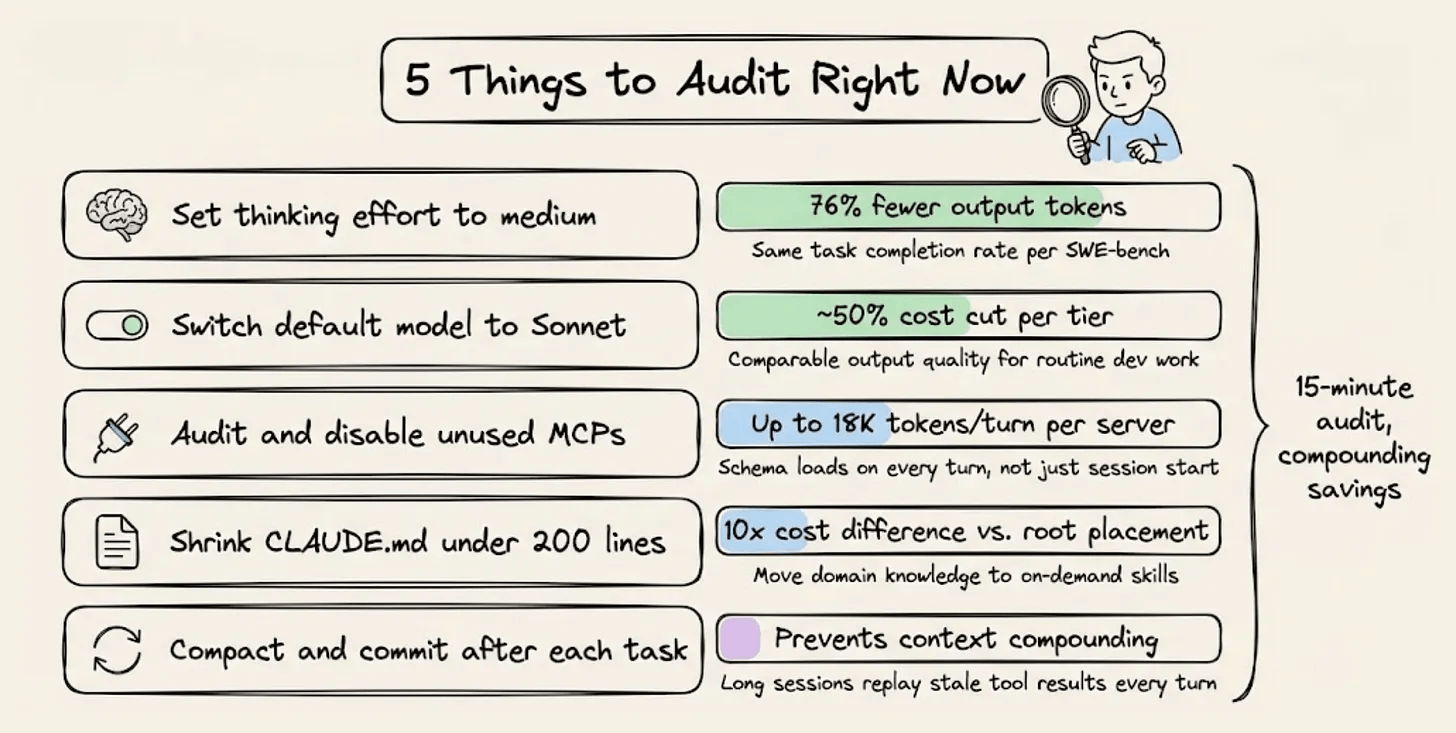
Audit your MCP servers: Open
~/.claude.jsonand your workspace.mcp.json. Disable any server you haven’t used in the past two weeks. The token savings from removing even two or three unused servers compound across every turn of every session.Shrink your CLAUDE.md: Keep it under 200 lines. Move domain knowledge, workflow guidance, and one-off fixes into on-demand skills that load only when relevant. The global file should contain only true invariants such as build commands, project architecture, and hard constraints.
Set thinking effort to medium: Same task completion rate, 76% fewer output tokens. This is the single highest-leverage setting change available.
Keep sessions short: Do one task, commit, compact or start a fresh session. Long sessions are where prior assistant context balloons and stale tool results keep getting replayed on every turn.
Review your default model: If Opus is your org default, check whether each task type needs it. Switching to Sonnet for routine development work cuts costs by roughly 40% with comparable output quality for most coding tasks.
For individual developers, the Opik Claude Code plugin is free and open source.
Install it via a single command:
/plugin marketplace add comet-ml/opik-claude-code-plugin You’ll get session-level tracing with full span breakdowns.
For teams that need org-level attribution, configuration policies, and one-click optimization across every developer, Cost Intelligence turns what would take hours of manual auditing into a single dashboard and is the single best optimization you can opt for.
Learn more about Opik Cost Intelligence here →
Here’s the Comet ML Opik GitHub Repo →
(don’t forget to star 🌟)
👉 Over to you: Have you audited your Claude Code configuration for token waste, and what was the biggest surprise when you looked at where your tokens were going?
Good day!