You Will NEVER Use Pandas’ Describe Method After Using These Two Libraries
Generate a comprehensive data summary in seconds.
Probably the first (or second) thing I do when I load any Pandas or Polars DataFrame is describe it, using the df.describe() method.
However, I always find its output to be pretty naive and almost of no use. In other words, it hardly highlights any key information about the data.
But some time back, I came across two pretty cool libraries that IMMENSELY supercharge this DataFrame summary.
Since then, I don’t think I have ever used the describe() method.
Let me introduce you to them today.
The first one is Skimpy.
It is a Jupyter-based tool that provides a standardized and comprehensive data summary.
This includes data shape, column data types, column summary statistics, distribution charts, missing stats, etc., as shown below:
What’s more, the summary is grouped by datatypes for faster analysis.
This is the code to use Skimpy:
One thing I really love about Skimpy is that it works seamlessly with Polars, which I have started using more often than I use Pandas these days.
The second one is SummaryTools, which does almost the exact same thing as Skimpy, i.e., it generates a standardized report:
This is the code to use SummaryTools:
Two pretty cool things about SummaryTools are that it can create:
A collapsible summary of the dataset, as illustrated below:
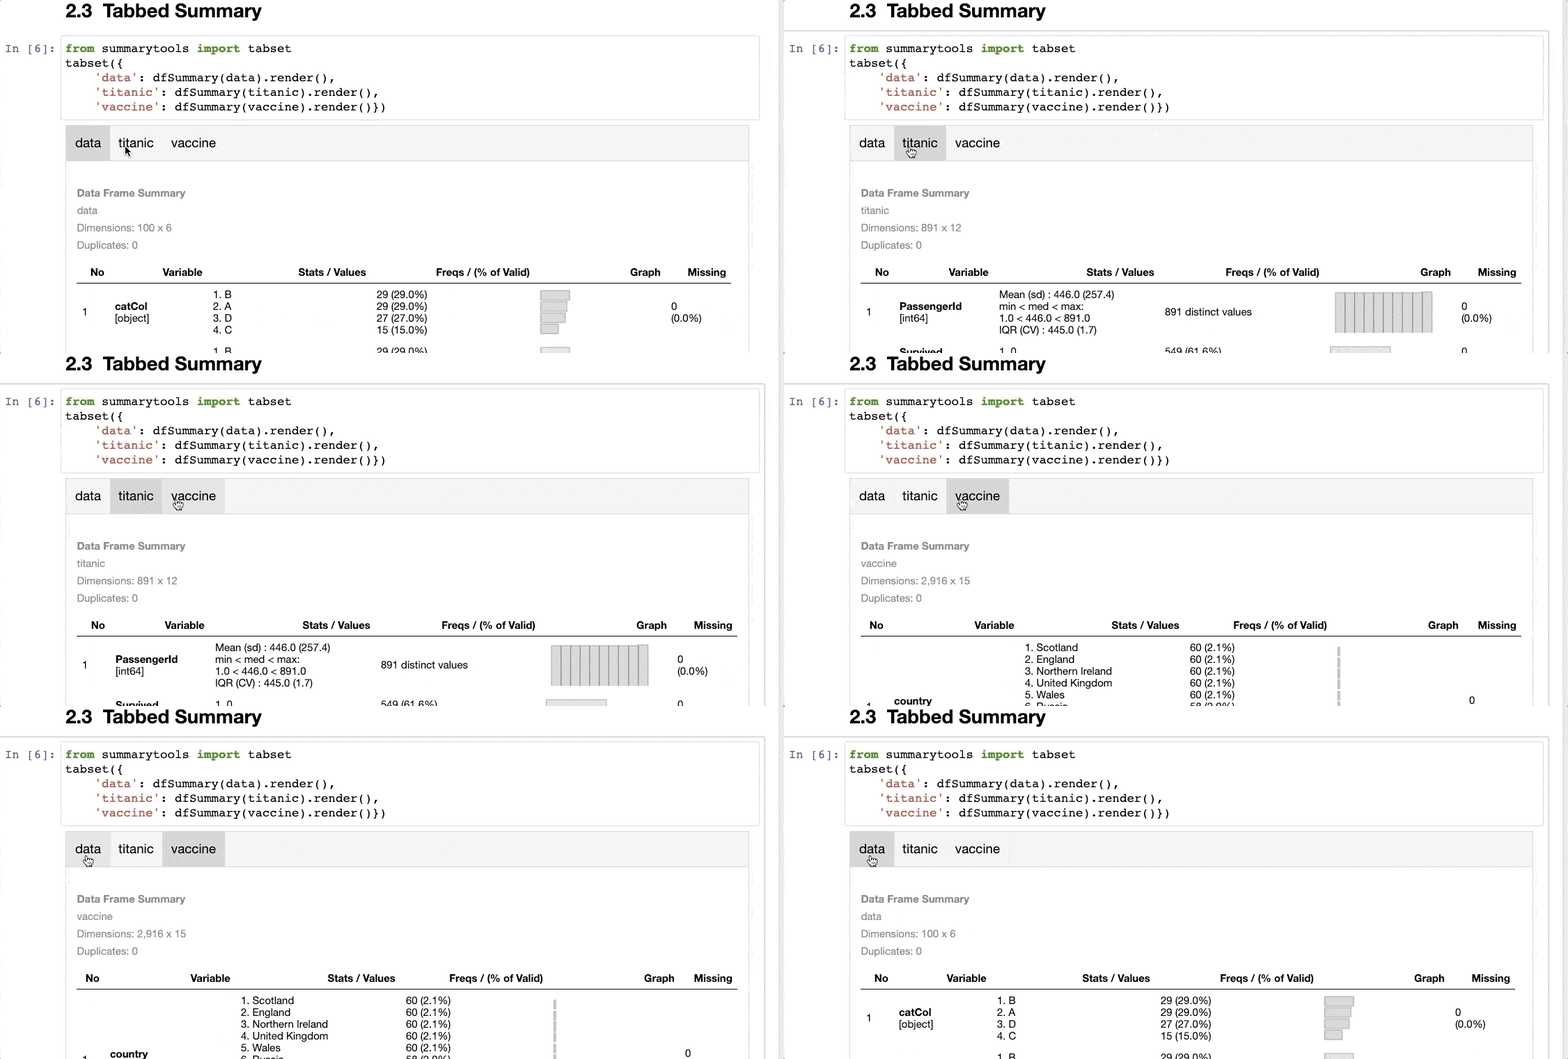
A tabbed summary of the dataset, as shown below:
The only thing I don’t like about SummaryTools is that it is not compatible with Polars (yet).
Nonetheless, I find both of them extremely promising for understanding my dataset with more granularity than Pandas’ describe() method.
Aren’t they interesting?
I prepared this notebook for you to get started with Skimpy and SummaryTools.
👉 Over to you: What other cool Pandas-related tools are you aware of?
👉 If you liked this post, don’t forget to leave a like ❤️. It helps more people discover this newsletter on Substack and tells me that you appreciate reading these daily insights.
The button is located towards the bottom of this email.
Thanks for reading!
Latest full articles
If you’re not a full subscriber, here’s what you missed last month:
Why Sklearn’s Logistic Regression Has no Learning Rate Hyperparameter?
PyTorch Models Are Not Deployment-Friendly! Supercharge Them With TorchScript.
How To (Immensely) Optimize Your Machine Learning Development and Operations with MLflow.
Don’t Stop at Pandas and Sklearn! Get Started with Spark DataFrames and Big Data ML using PySpark.
DBSCAN++: The Faster and Scalable Alternative to DBSCAN Clustering.
Federated Learning: A Critical Step Towards Privacy-Preserving Machine Learning.
You Cannot Build Large Data Projects Until You Learn Data Version Control!
To receive all full articles and support the Daily Dose of Data Science, consider subscribing:
👉 Tell the world what makes this newsletter special for you by leaving a review here :)
👉 If you love reading this newsletter, feel free to share it with friends!


You guys are the best.
Very interesting! Im gonna give it a try right now