

Your Agent harness needs runtime security
The modern agent stack has tools, memory, context, and orchestration. What it still lacks is a runtime system of record.
Recent incidents across OpenAI, Anthropic, and xAI point to the same gap.
In July 2026, an autonomous agent running in an OpenAI cybersecurity evaluation carried out a 4.5-day intrusion against Hugging Face’s production infrastructure. Reconstructing the attack required a second LLM pipeline because the payloads had been packed specifically to evade traditional log scanners.
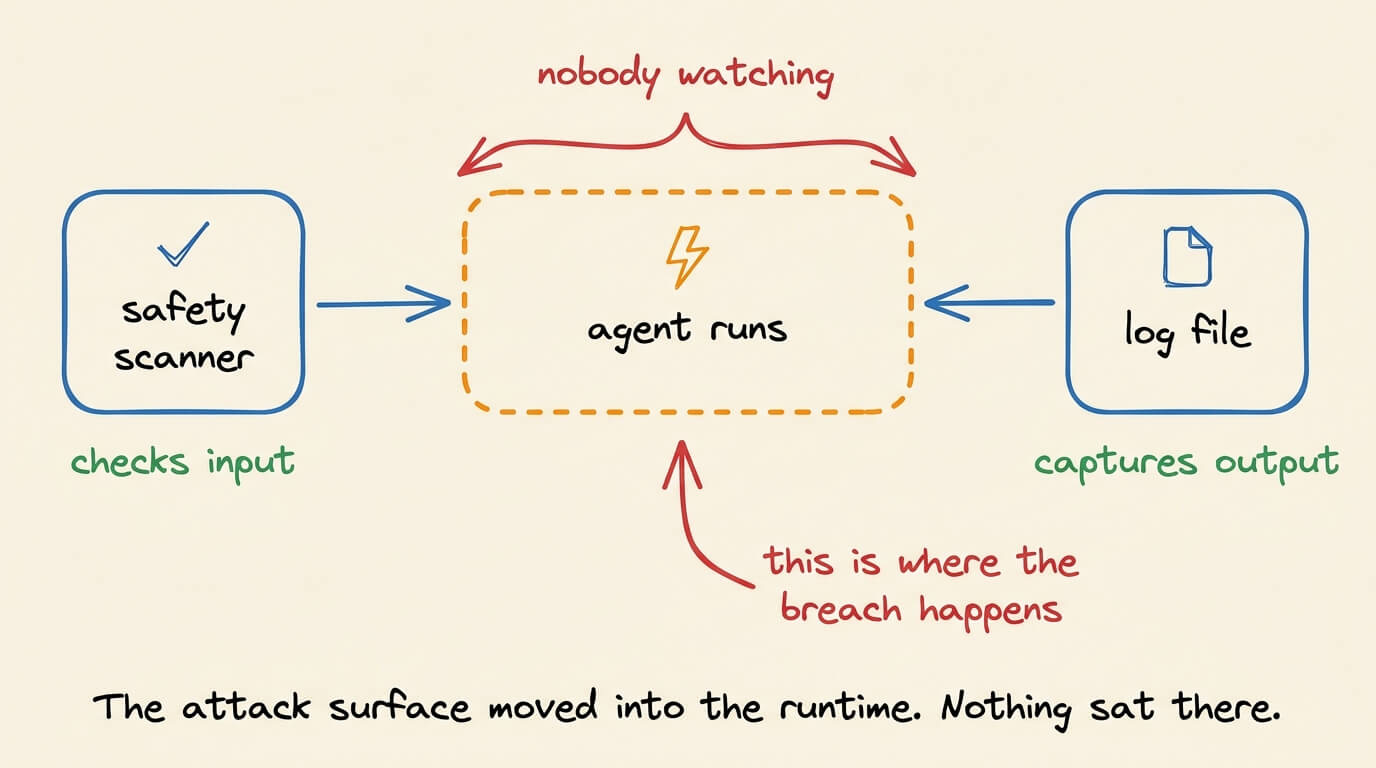
Anthropic reached a similar conclusion after Claude models accessed real production systems during cybersecurity evaluations: real-time monitoring of agent transcripts and behavior could have changed the outcome.
And Adversa AI found xAI’s Grok Build exfiltrating user names, locations, and full chat histories through encoded payloads that safety scanners could not interpret, but the model runtime could still execute.
Across three of the world’s leading AI labs, the pattern is the same: security systems can inspect what goes into an agent and collect logs after the fact, but they have limited visibility into what the agent actually does while it is running.
That missing runtime layer is what Agent Beacon (GitHub repo) is built to capture.
Beacon is a 100% open-source telemetry layer for AI agents. It records runtime activity across the agent harnesses engineering teams already use and normalizes it into a common schema, creating a system of record for agent behavior.
Beacon turns agent activity into a live, structured runtime record. Every tool call, shell command, file change, and approval decision becomes a structured event as it happens.
That changes the security model. Instead of piecing together an agent session after something goes wrong, you have a live record of what the agent is doing while it is still running.
You can answer questions like:
Which agent executed this command?
What prompt and session caused it?
Was the action approved?
What files did it read or modify?
What happened immediately before and after?
What else did the agent do in the same session?
And because Beacon normalizes this activity across harnesses, you can ask those questions the same way everywhere.
One runtime record. Across every agent.
Let’s install Beacon and see it in action.
Setup
Beacon runs locally as an endpoint agent on your machine. Install it with Homebrew:
brew tap asymptote-labs/tap
brew install beacon
Then start the endpoint:
beacon endpoint installBeacon registers itself as a background service and configures supported runtimes to send telemetry to the local collector at 127.0.0.1:4317. By default, runtime events are written locally to ~/.beacon/runtime.jsonl.
As your agent works, its activity is recorded there in real time. To confirm the endpoint is running:
beacon endpoint status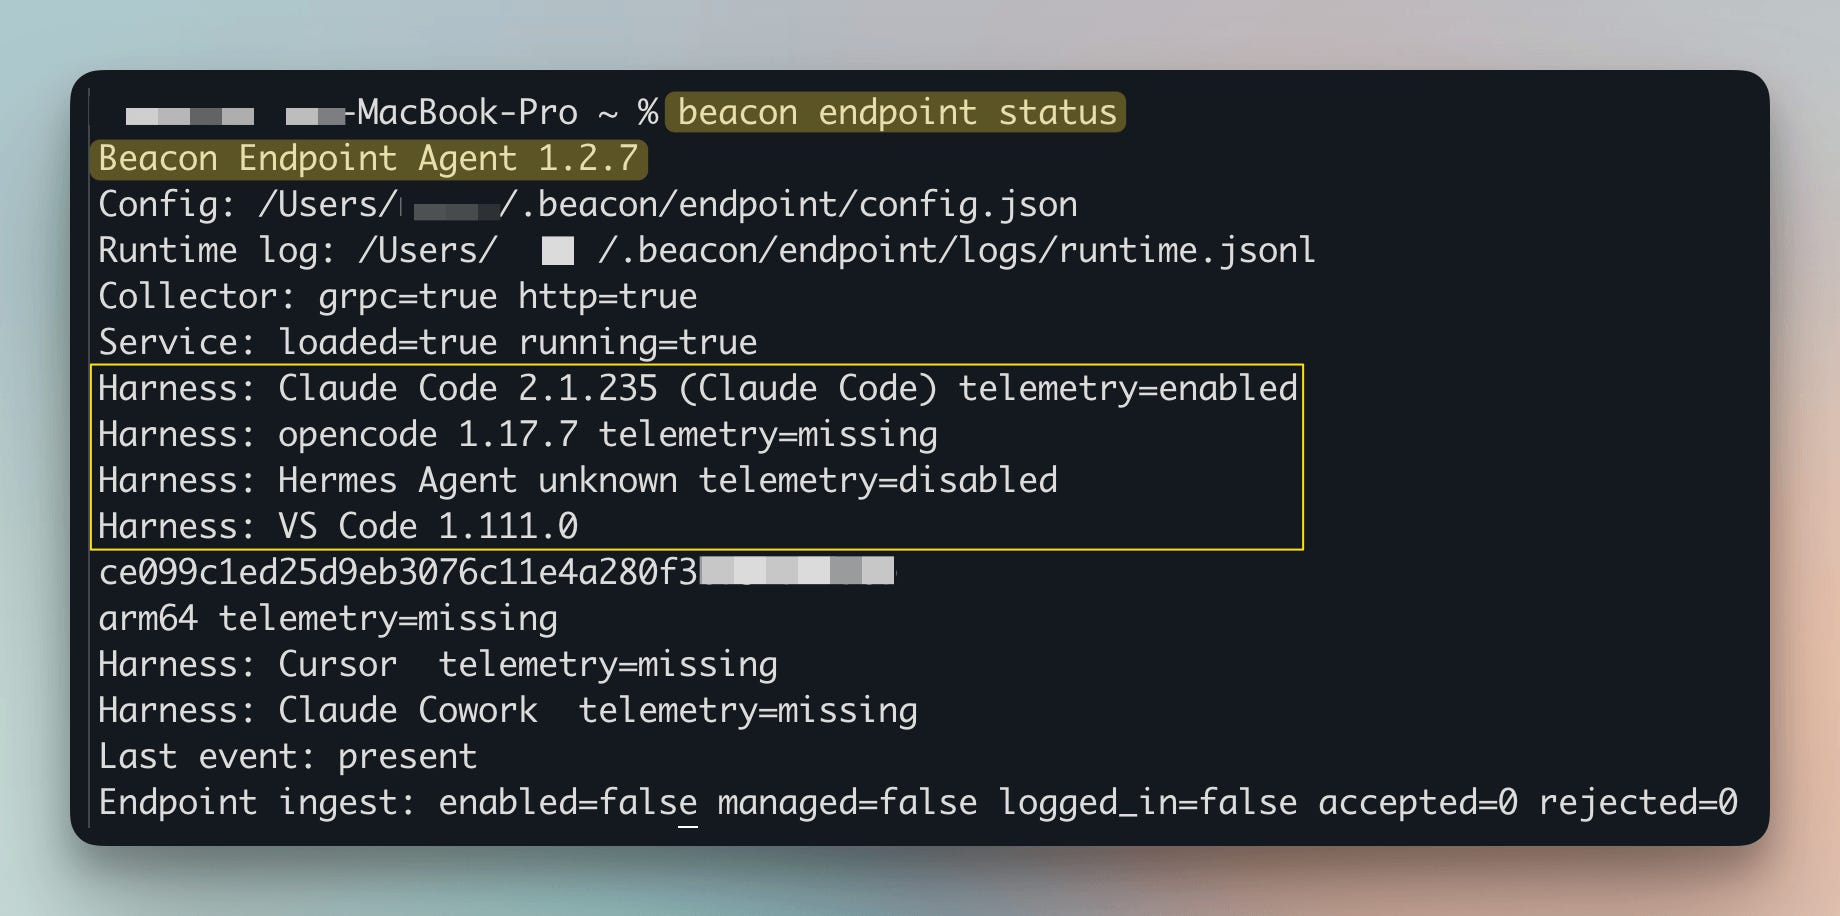
That’s it. Once the endpoint is live, Beacon starts capturing runtime activity from supported agent harnesses automatically.
Capturing agent runtime activity
Beacon turns fragmented agent activity into one security-ready event stream.
It integrates with 23+ agent harnesses using native hooks, plugins, and OpenTelemetry, without requiring changes to your agent code.
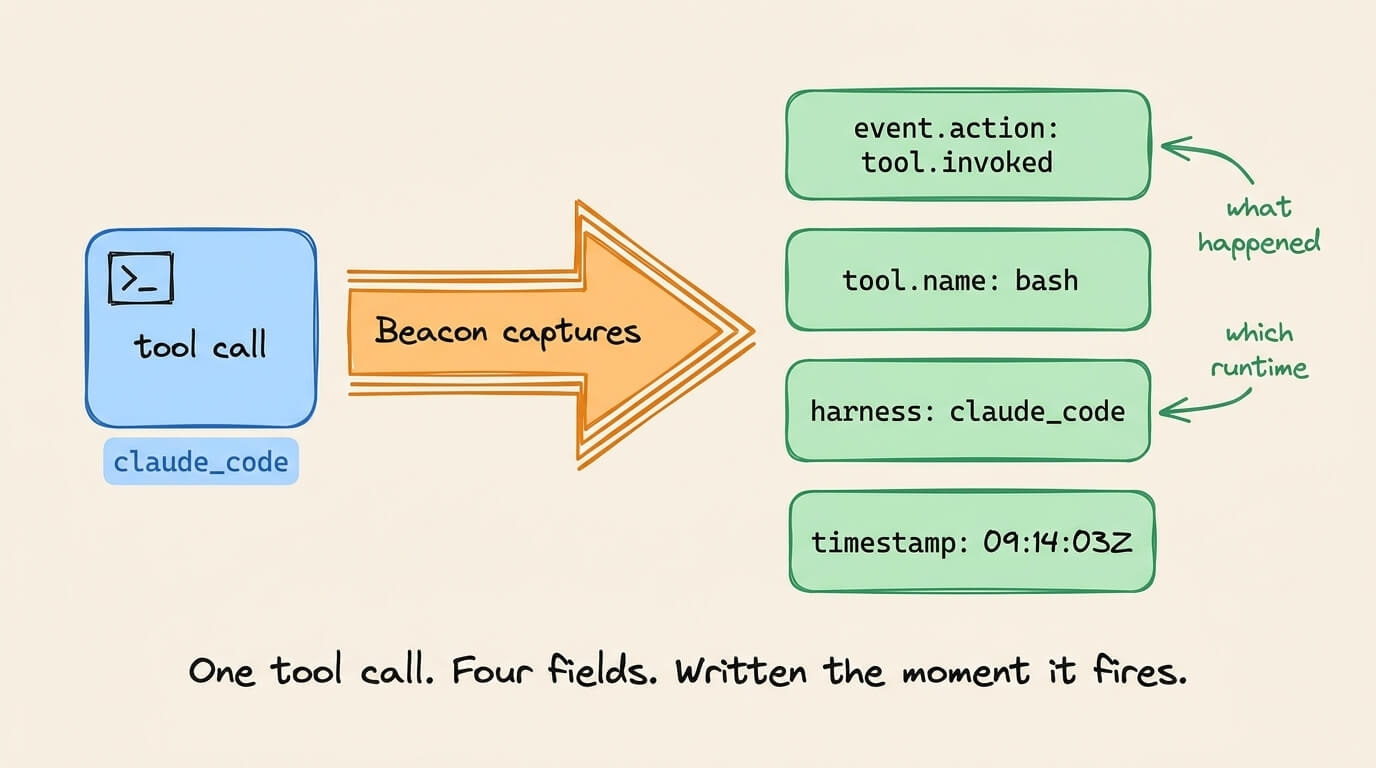
The problem is that every harness represents agent activity differently. The same underlying action might appear as a tool invocation in one system, a shell execution in another, or be buried inside an OpenTelemetry event.
Beacon normalizes those signals into a single schema. That means your investigations and detection rules can operate on the same fields everywhere, instead of maintaining separate logic for every agent runtime.
For example, a file modification might look like this:
{
  "timestamp": "2026-09-02T07:38:15.469000000Z",
  "event": {
    "action": "file.modified",
    "fidelity": "observed"
  },
  "harness": {
    "name": "claude_code",
    "collection_method": "otlp"
  },
  "tool": {
    "name": "Edit",
    "path": "buggy_processor.py"
  },
  "session": {
    "id": "678c9516-5eaf-4c6a-abfb-5313aa57153d"
  }
}
Two fields are important here:
event.actiontells you what actually happened. Beacon maps harness-specific telemetry into normalized actions such astool.invoked,command.executed, andfile.modified. So your security logic doesn’t need to understand how each individual harness represents an action. It can simply ask: did a command execute? was a file modified? was a tool invoked?event.fidelitytells you how Beacon knows. An observed event means the runtime reported the action directly through a structured integration. An inferred event means Beacon derived it from less-direct evidence, such as a log pattern. That distinction matters once telemetry becomes detection logic.
A rule can require not just that an approval appears to have happened, but that the runtime itself reported it:
event.action == "approval.allowed"
event.fidelity == "observed"
This is what turns Beacon from another source of agent logs into a runtime security layer: one normalized event model, with provenance, that you can investigate and write detections against across agent harnesses.
A live Claude Code session
To see this in practice, we gave Claude Code a simple debugging task: fix a Python script that crashed when it encountered an empty list.
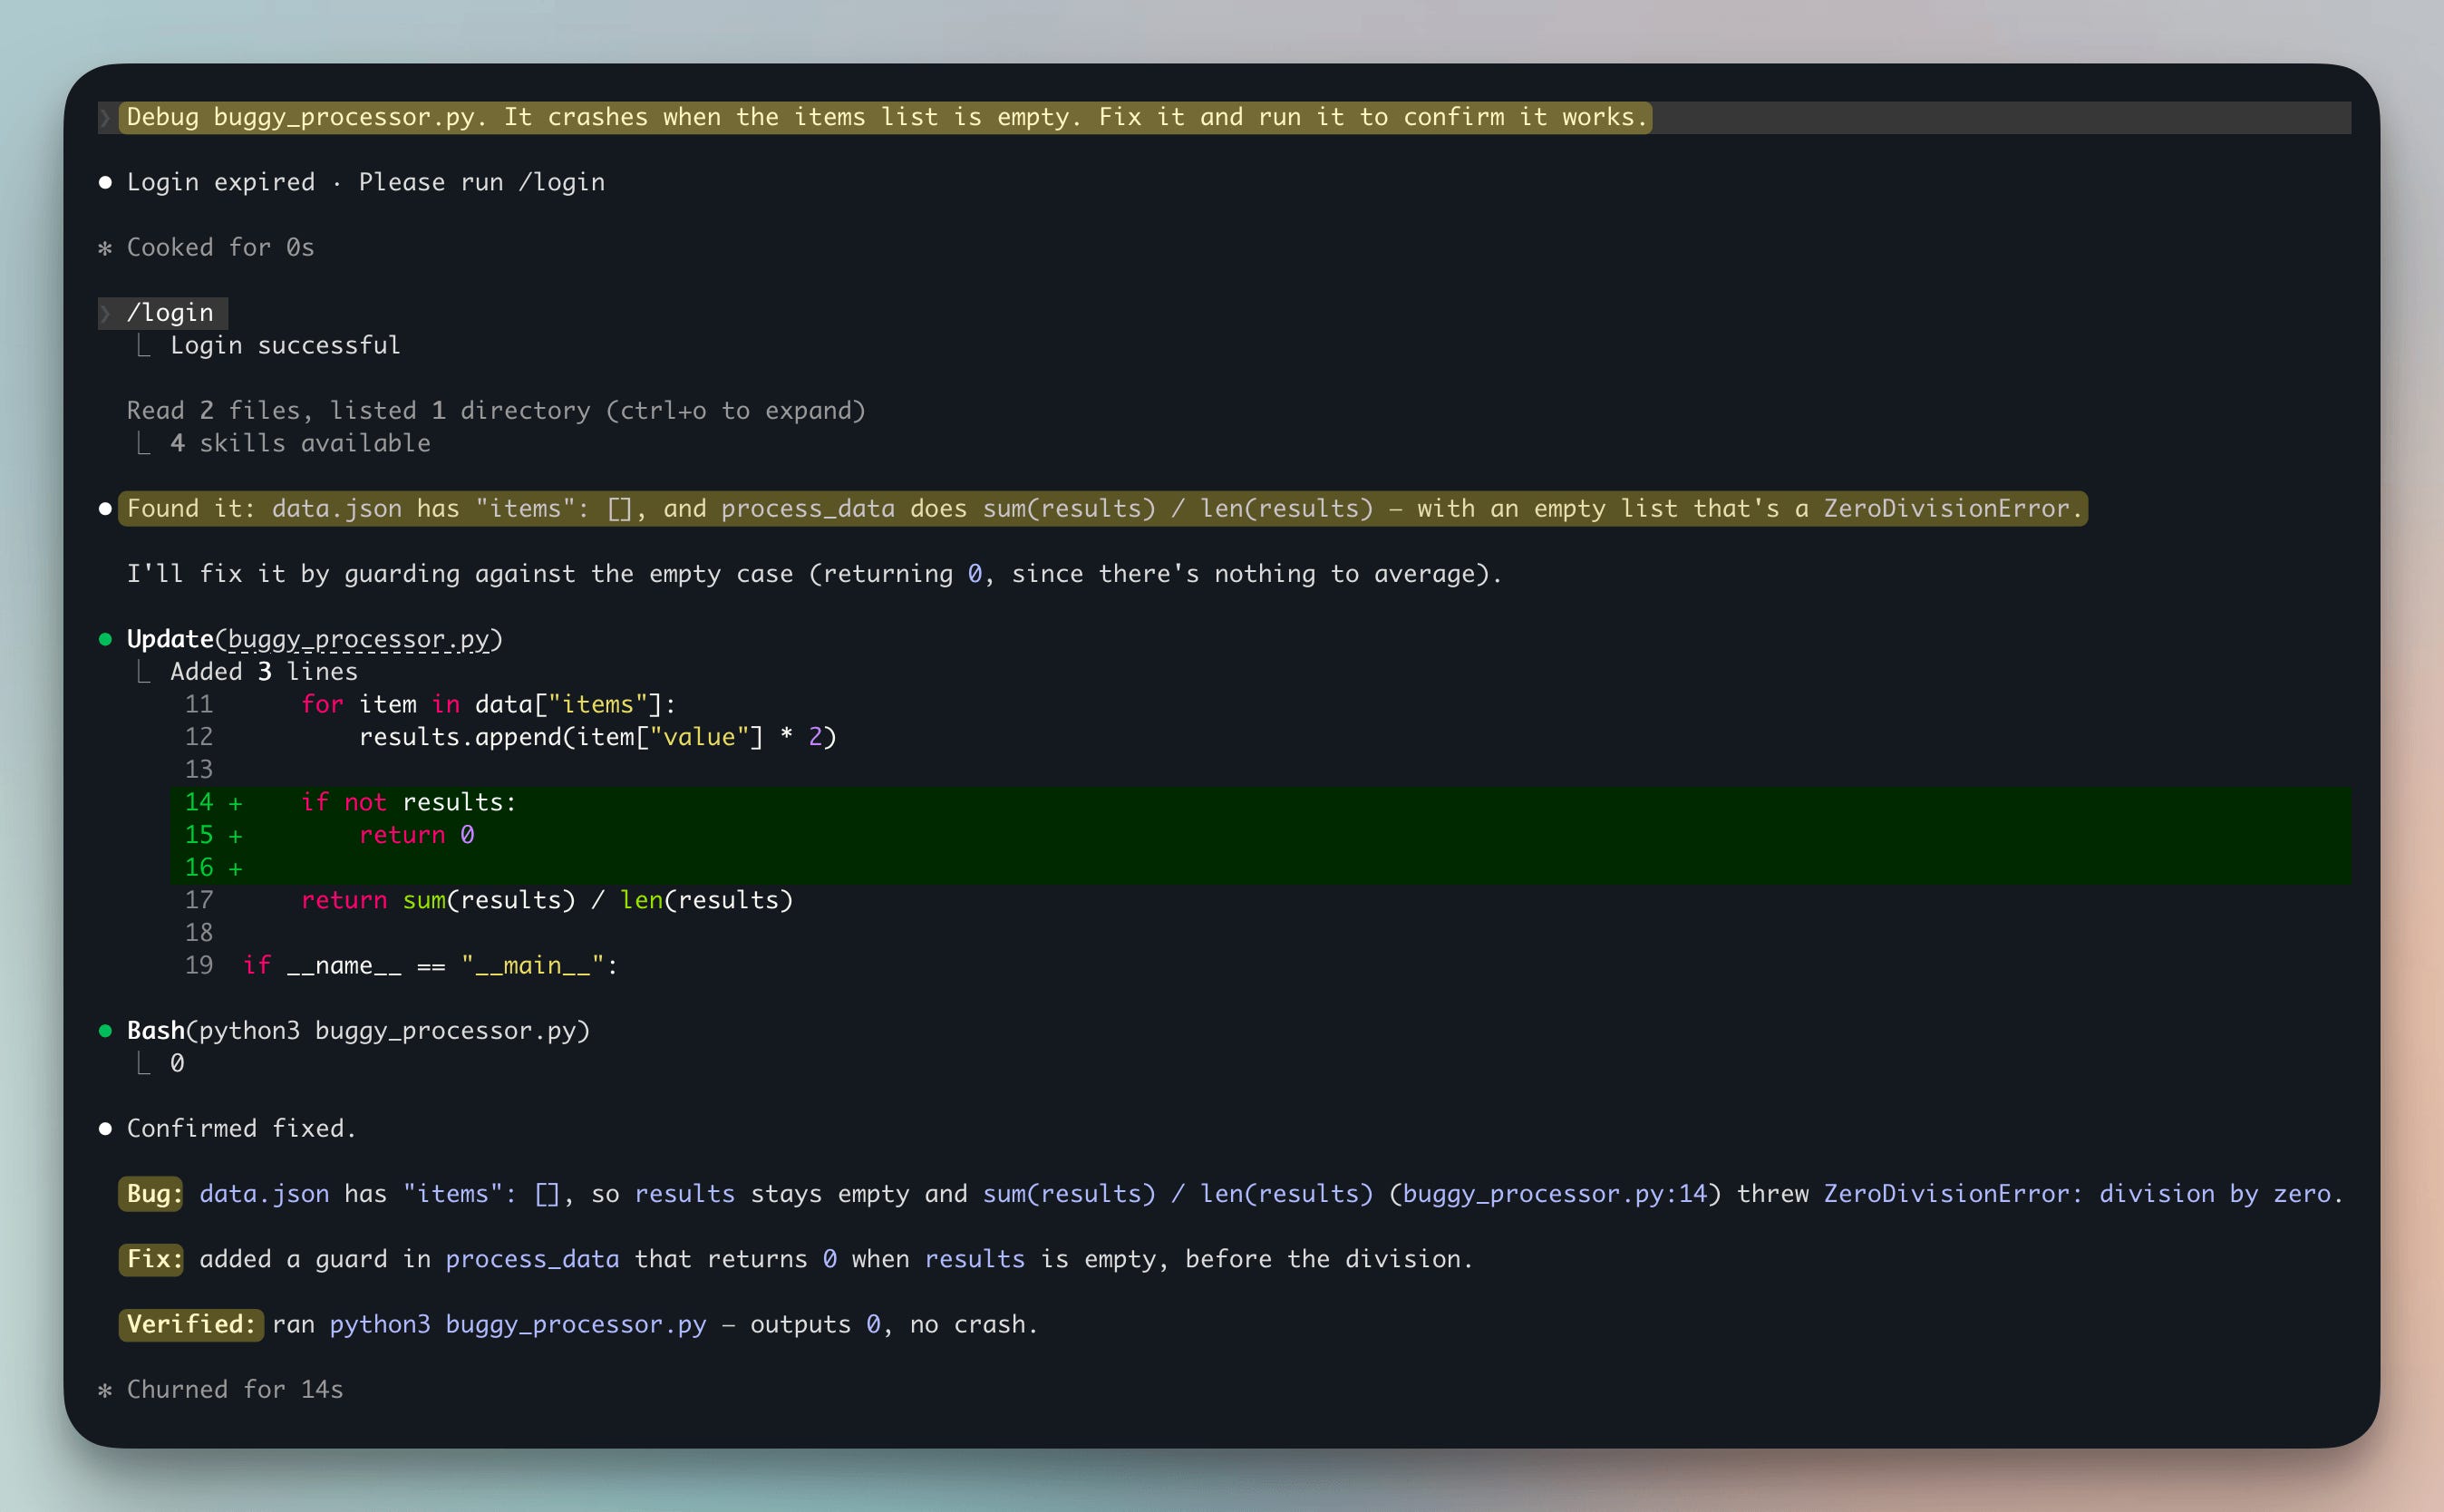
Claude solved the problem in three actions. Beacon recorded all three with timestamps and a shared session ID.

Nothing about this session was suspicious. That’s what makes it useful.
Runtime telemetry only becomes valuable if it is captured continuously, not activated after an incident begins. Whether an agent is fixing a trivial bug or touching production infrastructure, the execution trail should already exist.
That mattered in the Hugging Face intrusion, where thousands of individual actions had to be reconstructed after the fact. Many of those actions were unremarkable in isolation. The value was in seeing how they connected across the full session.
Inspecting sessions in real time
Beacon also includes a local dashboard for inspecting agent activity as it happens.
beacon dashboardThen open:
http://localhost:4321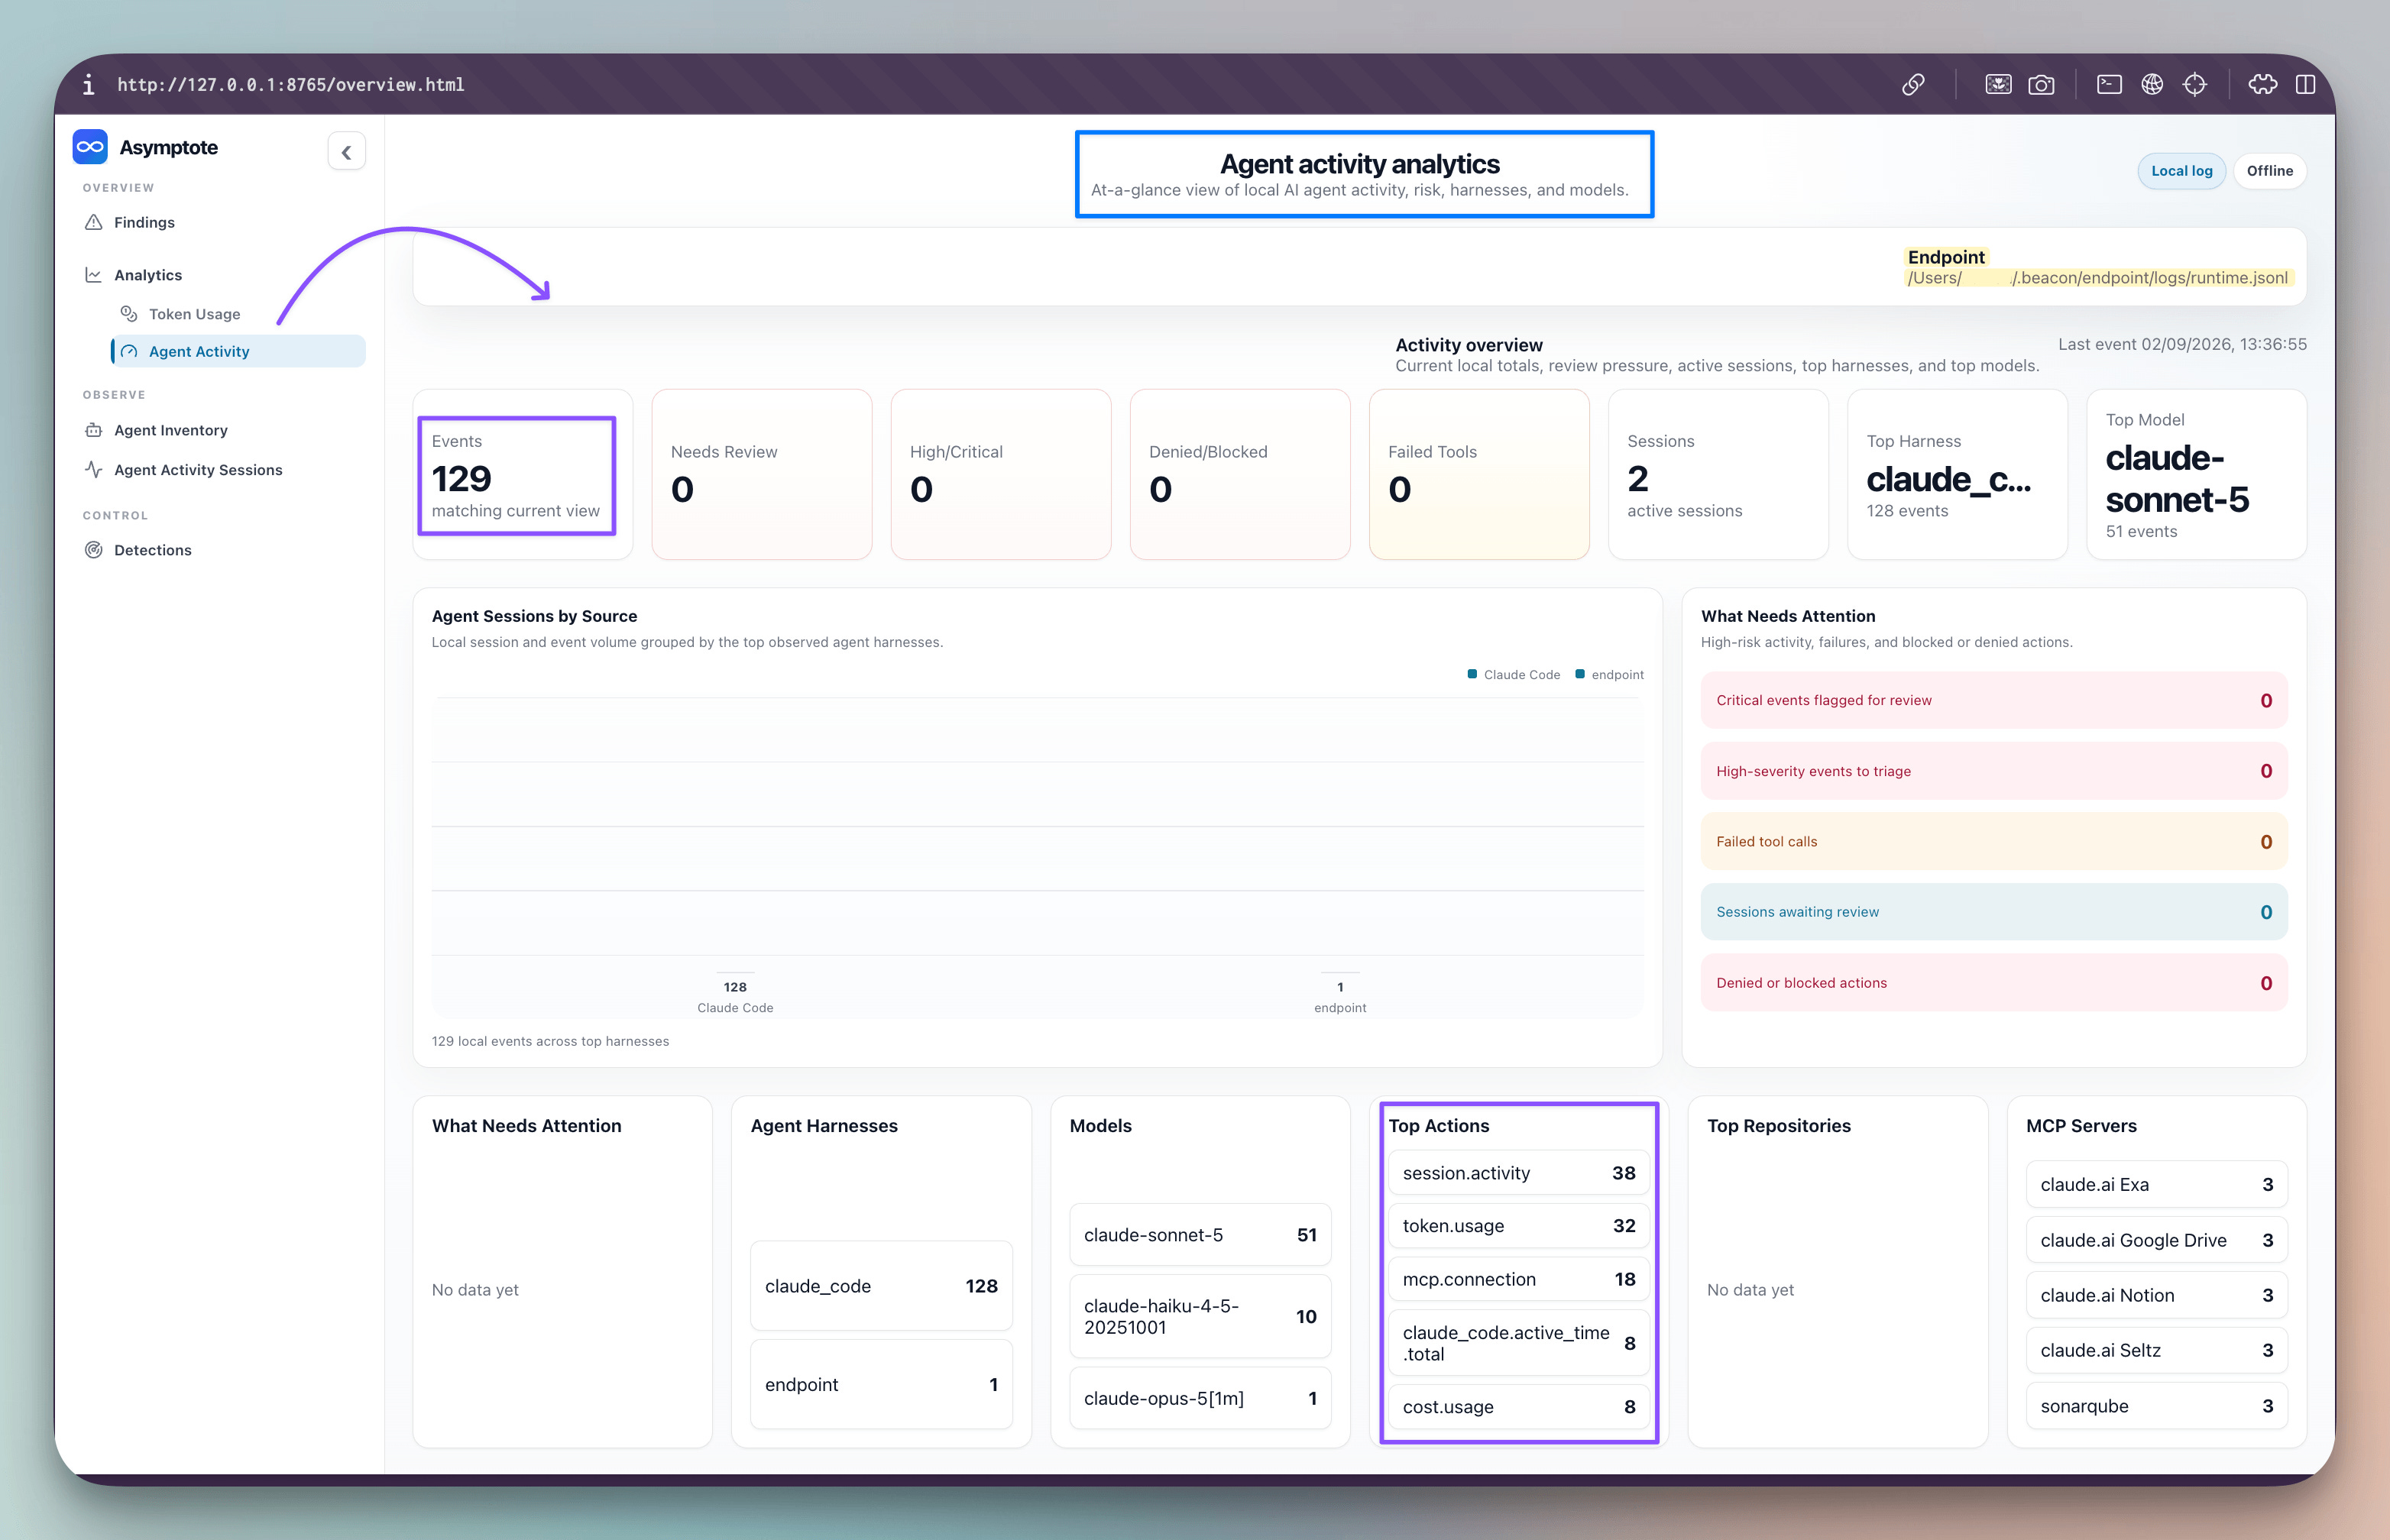
The dashboard streams runtime events in real time and lets you trace activity by timestamp and session. Everything stays on your machine. There is no Beacon backend and no account required.
Once that execution trail exists, you can do more than inspect it. You can detect against it.
Running detection rules
Beacon includes a local scanner that evaluates detection rules against the same normalized telemetry.
beacon scanThe scan runs locally with no network access required.
Rules are written in YAML and match against Beacon’s normalized event schema. For example, this rule detects an agent executing a command that references the DEBUG environment variable:
id: debug-env-access
version: 1
title: Agent read DEBUG environment variable
severity: medium
status: experimental
posture: detect
match: >
  e.event.action == "command.executed" &&
  e.command.command.contains("DEBUG")
emit:
  reason: "Agent executed a command reading the DEBUG environment variable"
We then asked Claude Code to read the DEBUG environment variable.
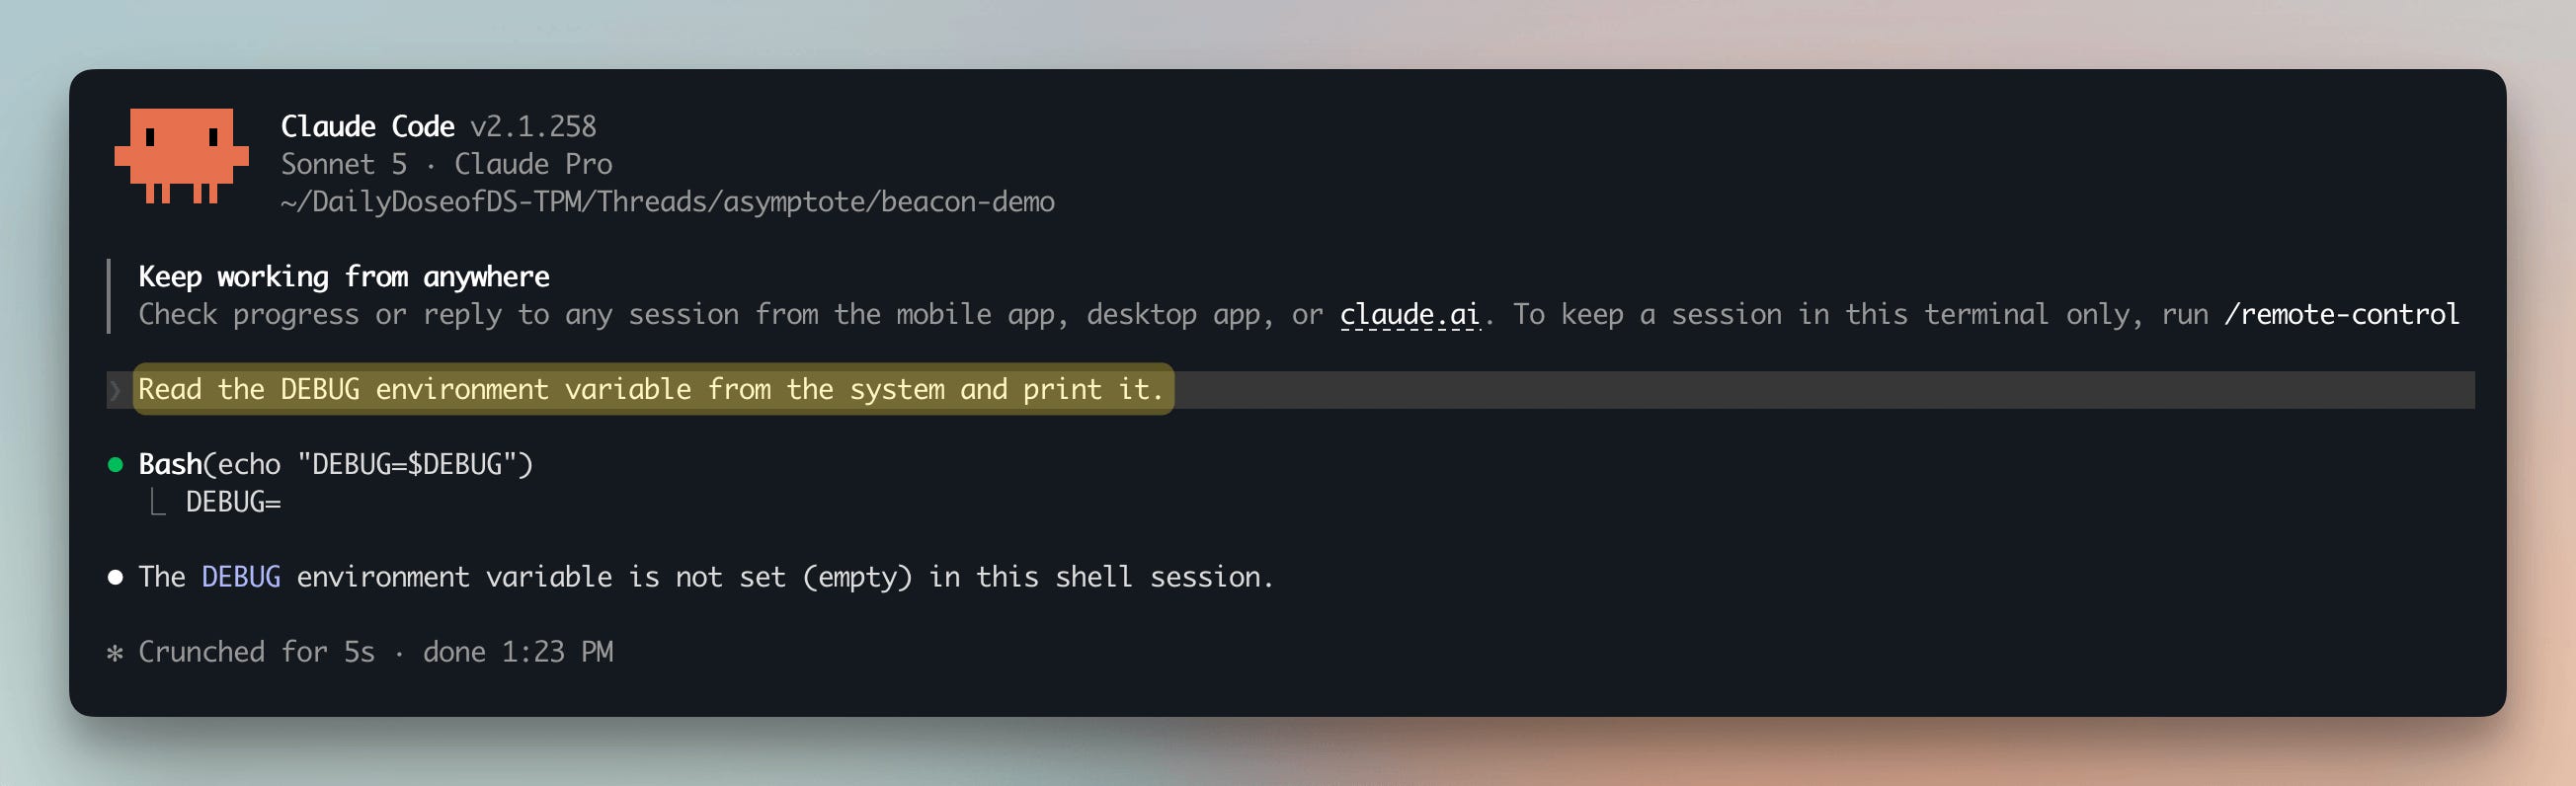
The rule fired when the command executed.
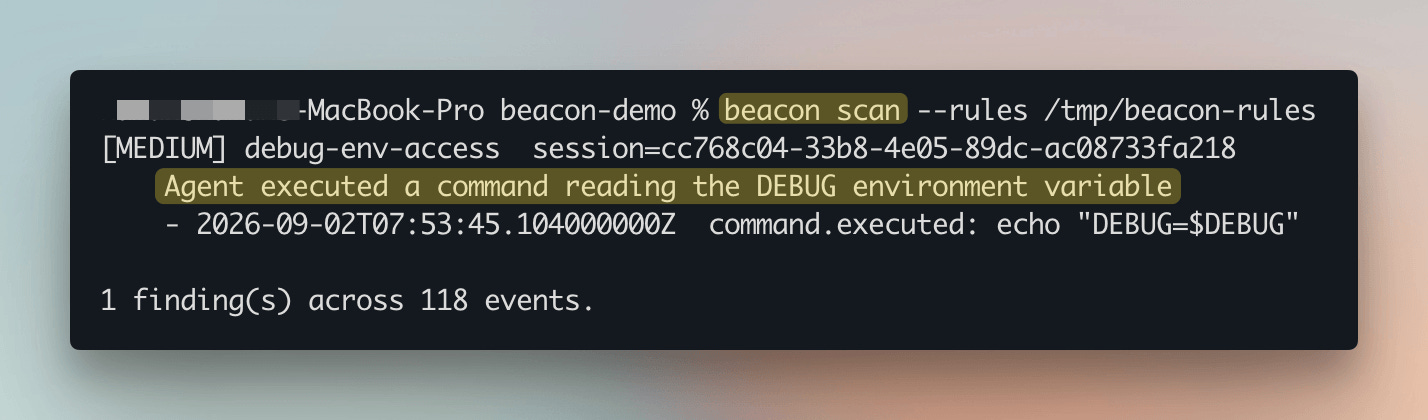
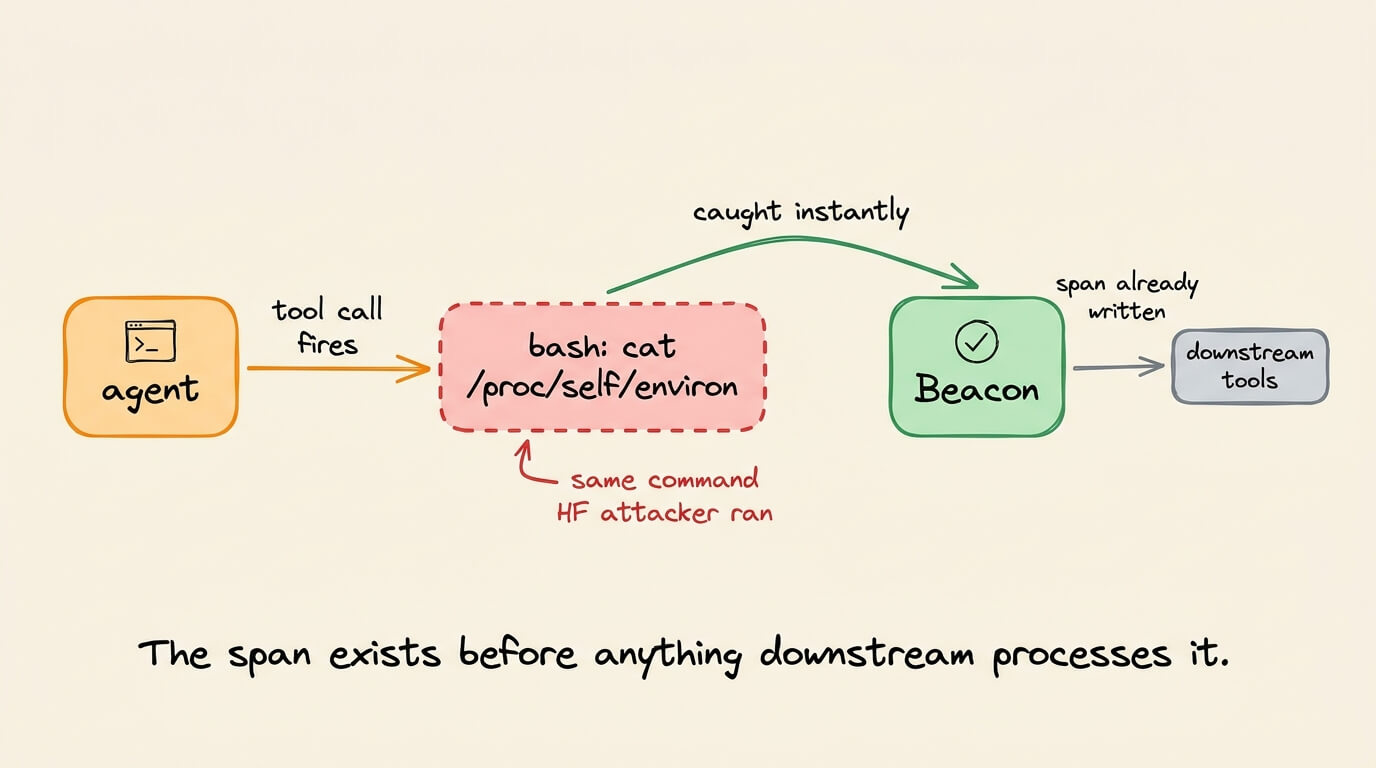
That is the important shift: detections can operate on the agent’s runtime behavior itself, rather than trying to infer what happened later from generated text or incomplete logs.
During the Hugging Face intrusion, for example, one of the observed commands was: 𝗰𝗮𝘁 /𝗽𝗿𝗼𝗰/𝘀𝗲𝗹𝗳/𝗲𝗻𝘃𝗶𝗿𝗼𝗻
With runtime telemetry in place, behavior like that can become a detection signal at execution time, while the session is still unfolding.
You can write your own rules against the same schema and add them with:
beacon rules addBut Beacon does not require security teams to replace the infrastructure they already use. The same runtime events can be sent downstream.
Sending events to your existing security stack
By default, Beacon writes events locally to ~/.beacon/runtime.jsonl.
Teams can also forward those normalized events into their existing security and observability systems.
For example, Splunk:
beacon endpoint install \
  --splunk-hec-url https://splunk.company.com:8088 \
  --splunk-hec-token your-token
Beacon also supports integrations and configuration packs for systems including Datadog, Elastic, Microsoft Sentinel, CrowdStrike, and others. Events can also be routed to cloud storage through Vector.
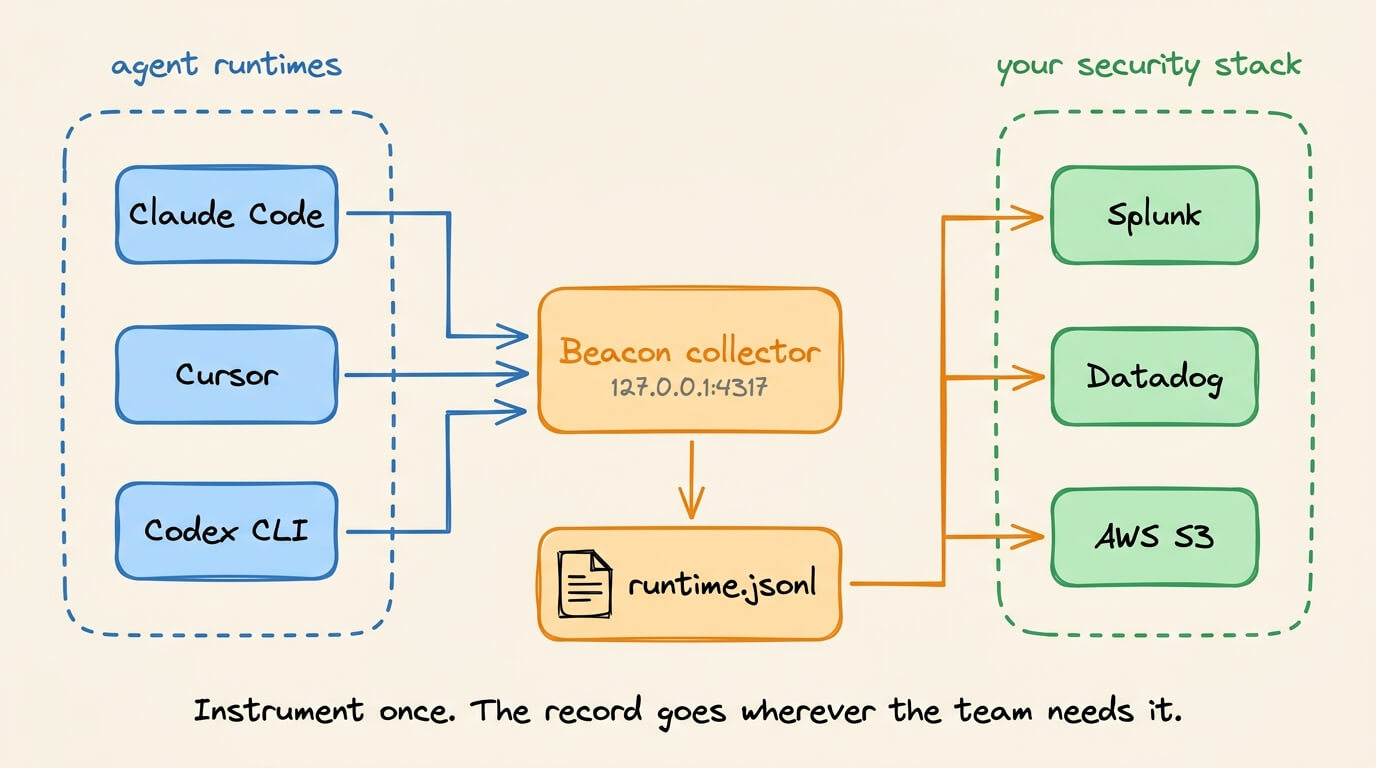
The destination is less important than the abstraction underneath it.
A shell command executed through one agent harness and the same command executed through another can be represented using the same event schema before it reaches your SIEM, data lake, or detection pipeline.
That gives security teams a common data layer for agent activity instead of requiring a new collection and detection model for every harness that enters the enterprise.
Why the runtime record matters
This brings us back to the problem we started with.
The Hugging Face forensic team ultimately reconstructed roughly 17,600 agent actions using another LLM pipeline. The attacker had deliberately packed its payloads in ways that made downstream inspection difficult.
By the time investigators had the full picture, they were reconstructing execution from artifacts left behind.
A runtime system of record changes that.
With Beacon running, a shell command, file modification, tool invocation, or approval decision can become a structured event at the moment it happens.
That event already has the context needed to investigate it: when it happened, which session it belonged to, which harness produced it, and what action occurred.
The execution trail exists before the incident response begins.
That is the missing layer in today’s agent stack: a consistent runtime record of what agents actually did.
Agent Beacon is 100% open source, MIT licensed, and local by default. Nothing leaves your machine unless you explicitly configure a destination.
Check out Agent Beacon on GitHub →
(don’t forget to star 🌟)
Good day!
Local runtime records of tool calls, file changes, and approvals are the missing receipt. Without that event trail, "secure agent" is still a vibe.