
Your Agent Harness Should Repair Itself
...covered with an open-source solution.

A GitHub repo to learn building production-grade voice agent apps

The voice agent stack is one of the few areas in AI where the demand is enormous, and the worked examples barely exist.
Speechmatics Academy has open-sourced a collection of runnable examples across batch, real-time, voice, and TTS, each standalone enough to clone a single folder and have a working pipeline in minutes.
The integrations have complete loops with LiveKit, Pipecat, Twilio, and VAPI, covering WebRTC capture, turn detection, speaker focus, interruption handling, and function calling.
The use cases it teaches cover production territory, including SRT captioning, call-center topic detection, and HIPAA-friendly medical microbatching with Silero VAD chunking.
While everyone debates voice as the next interface, this is the repo that shows how to actually build for it.
You can find the GitHub repo here → (don’t forget to star it ⭐️)
Thanks to Speechmatics for partnering today!
Your agent harness should repair itself
When an AI agent fails in production, the observability tool only shows exactly what it did and almost nothing about how to fix it.
You get a clean trace of every model and tool call, the latency per step, and the token usage. What you don't get is why the trace broke, the change that fixes it, or any guarantee that the same failure won't recur.
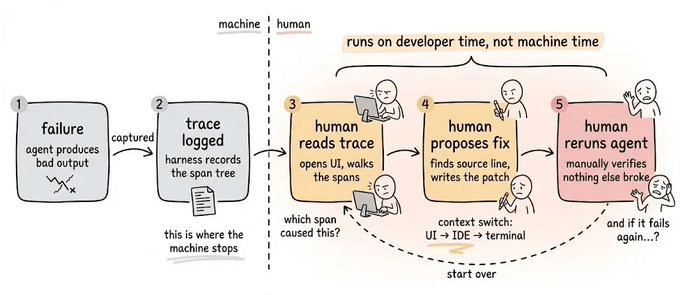
So you scroll the trace span by span, form a theory, write a patch, and hope it doesn’t break something that already worked.
Then a new model ships with its own failure modes, and you run the loop again from the top.
Cursor recently shared how much engineering goes into the harness around their agent, the prompt layers, tools, and checks wrapped around the raw model. Every model upgrade and every new tool widens that surface.
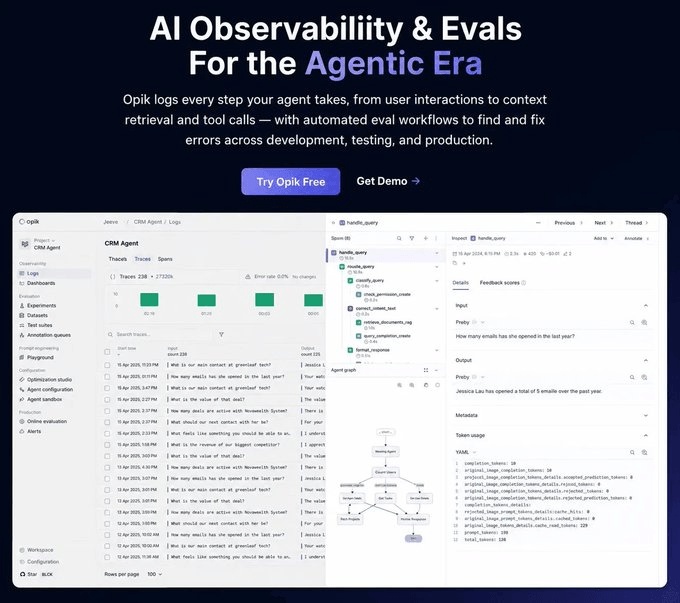
Today, let’s look at how you can use Opik (open-source) to solve this.
The four-layer stack in Opik
For context, Opik is an open-source logging, debugging, and optimization platform for AI agents and LLM apps.
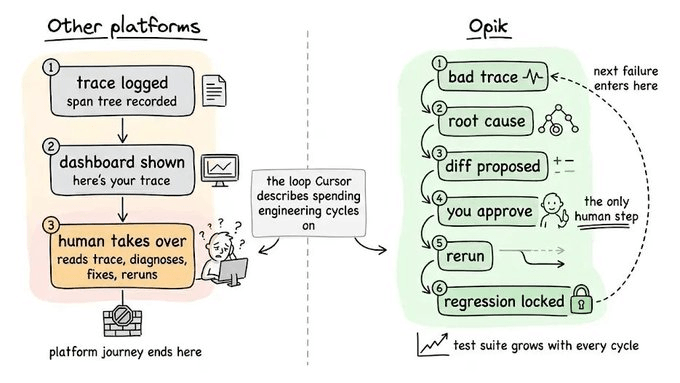
Opik is built around the premise that the observability loop should be automated, not staffed, which is why Opik’s architecture is one connected workflow.
Trace → Ollie diagnoses → Ollie proposes a fix → fix is applied and verified → Test Suite locks the failure as a regression test → back to Trace
Let’s look at each layer.
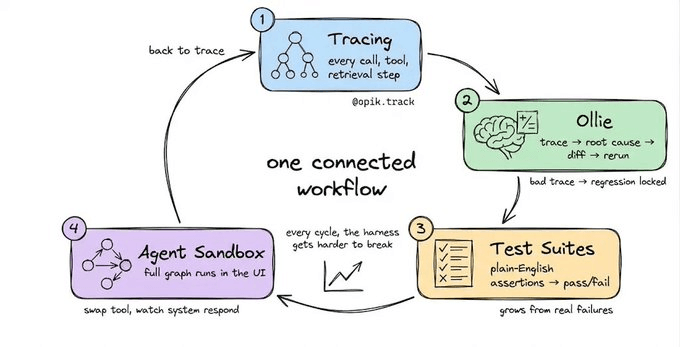
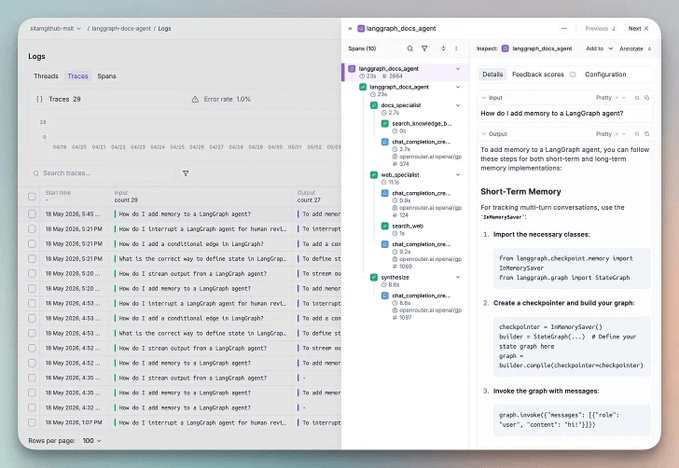
Layer 1: Tracing
Every LLM call, tool invocation, and retrieval step is instrumented automatically with a single decorator.
import opik

@opik.track
def my_agent(query: str):
    # your agent logic here
    ...
This works with LangGraph, CrewAI, and 50+ frameworks. Every trace records which agent configuration was active for full reproducibility when you need to rerun a failing input later.
Layer 2: Ollie
Opik’s Ollie is a recent addition that accepts a trace and fixes code. It is a coding agent built into Opik with full context.
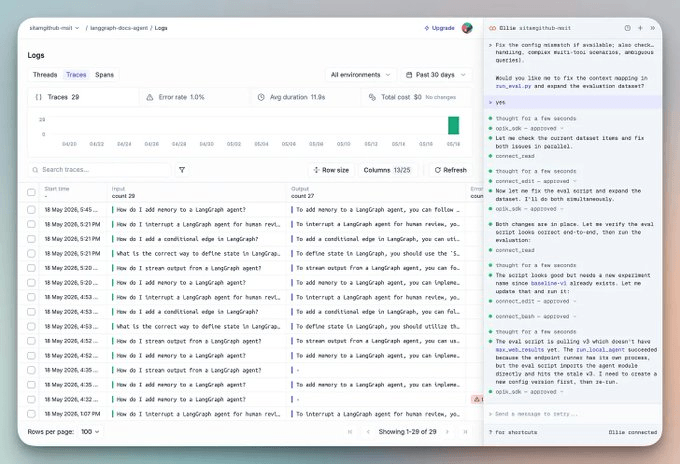
If you run it on your project root, Ollie will:
Read your source files
Identify the exact lines responsible
Propose a diff (nothing changes without your explicit approval)
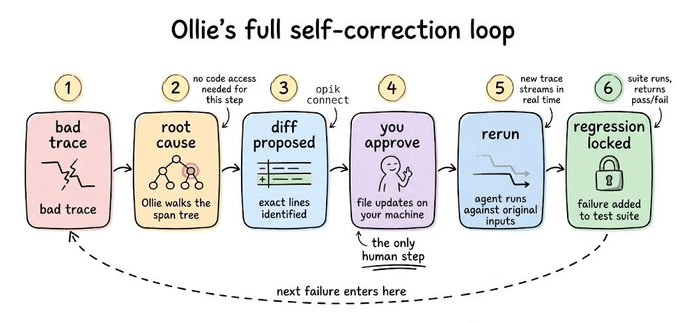
Once you approve, Ollie reruns the agent against the exact inputs from the original failing trace, streams the new trace for side-by-side comparison, and locks the original failure as a regression case in your test suite.
Bad trace → root cause → diff → approve → rerun → regression locked
Without any code access, Ollie reads span trees, identifies failure modes, and explains the causal chain across every LLM call. If you ask it, “why did the final answer ignore the retrieved context?”, it walks the full span tree and surfaces the root cause.
Layer 3: Test suites
Eval workflows typically build a labeled dataset, define a numerical metric, and compare floats, but it doesn’t match how engineers think about quality.
You can replace it with plain-English assertions in Opik:
suite = opik.TestSuite("crm-agent-v2")

suite.add_assertion("The response must include specific deal details, not just a count")

suite.add_assertion("The response must never reveal unauthorized information")

suite.run_tests()
Opik converts those into LLM-as-a-judge checks under the hood and gives clean pass/fail per test case.
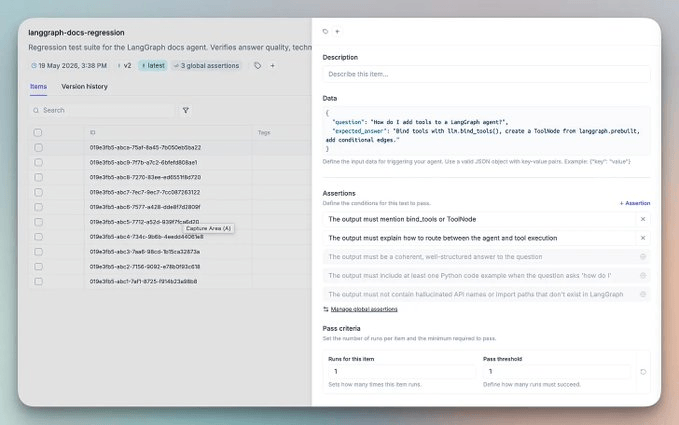
Here, every failing trace you debug automatically becomes a new test case, so the test suite naturally grows from real production failures.
Every cycle, the harness gets harder to break.
But even with a growing test suite, you still need a safe place to test changes before they ship. That’s what Layer 4 is for.
Layer 4: Agent sandbox
Most playgrounds are prompt playgrounds. Changing a system prompt and rerunning the LLM call answers the wrong question.
The production question is, what happens to the entire agent graph when I change something?
Opik’s Agent Sandbox runs the fully instrumented agent end-to-end inside the UI. Change a prompt, swap a model, add a tool, and watch how the whole system responds across the full spanning tree.
Every sandbox run produces a complete Opik trace.
In practice
The layers aren’t independent features. They’re one loop that you can instrument with @opik.track.
If something fails in production.
Ollie reads the trace + source code and proposes a fix.
You approve.
Ollie reruns the agent in the Sandbox against the original failing input.
Once fixes pass, it saves it as a new blueprint.
The environment pointer promotes to staging.
Finally, the original failure is locked as a regression test.
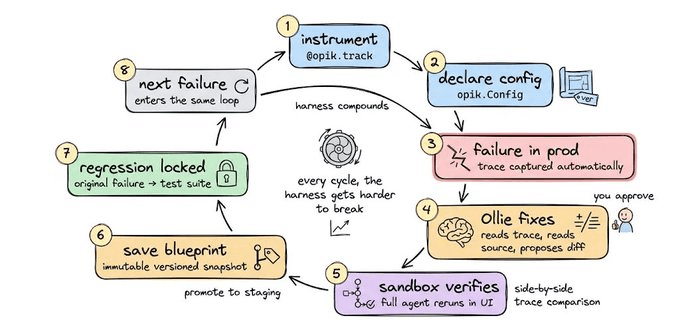
The next failure (if any) enters the same loop.
And in every cycle, the harness gets harder to break.
The whole stack we discussed today is open-source (19k+ stars), covering Tracing, Ollie, Test Suites, the Agent Sandbox, a 6-algorithm Agent Optimizer, and 50+ framework integrations.
You can self-host everything in three commands:
git clone https://github.com/comet-ml/opik
cd opik
./opik.sh
Here’s the Opik GitHub Repo → (don’t forget to star 🌟)
👉 Over to you: What’s the current state of observability in your agent stack, and where does the debugging loop break for your team right now?
Good day!