Are You Assessing Monotonicity or Linearity?
Monotonic != Linear.
Imagine you are quantifying the association between two variables.
As one variable increases, the other variable may increase too.
But standard association metrics, like Pearson correlation, impose a restriction on the kind of associations we can quantify with them.
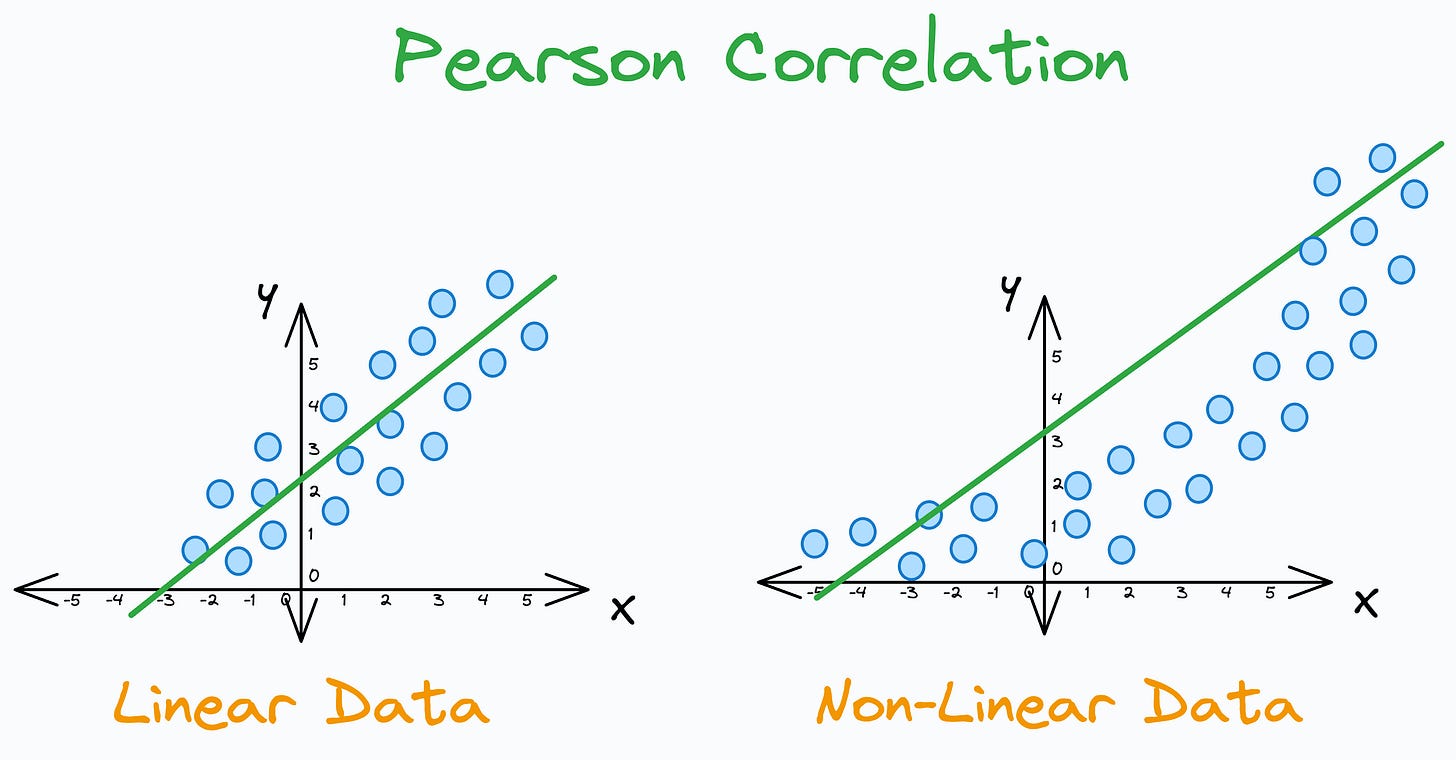
More specifically, while the true association can be monotonic, it may not necessarily be linear.
But Pearson correlation measures associations as if they were linear.
This can be an unrealistic assumption in most situations and will lead to penalizing the association between the two variables, which are monotonic but not necessarily linear.
It is essential to be aware of this since many frameworks (in Pandas, for instance) have it as their default correlation metric.
Spearman correlation is a better alternative in such cases.
It assesses monotonicity, which can be linear as well as non-linear.
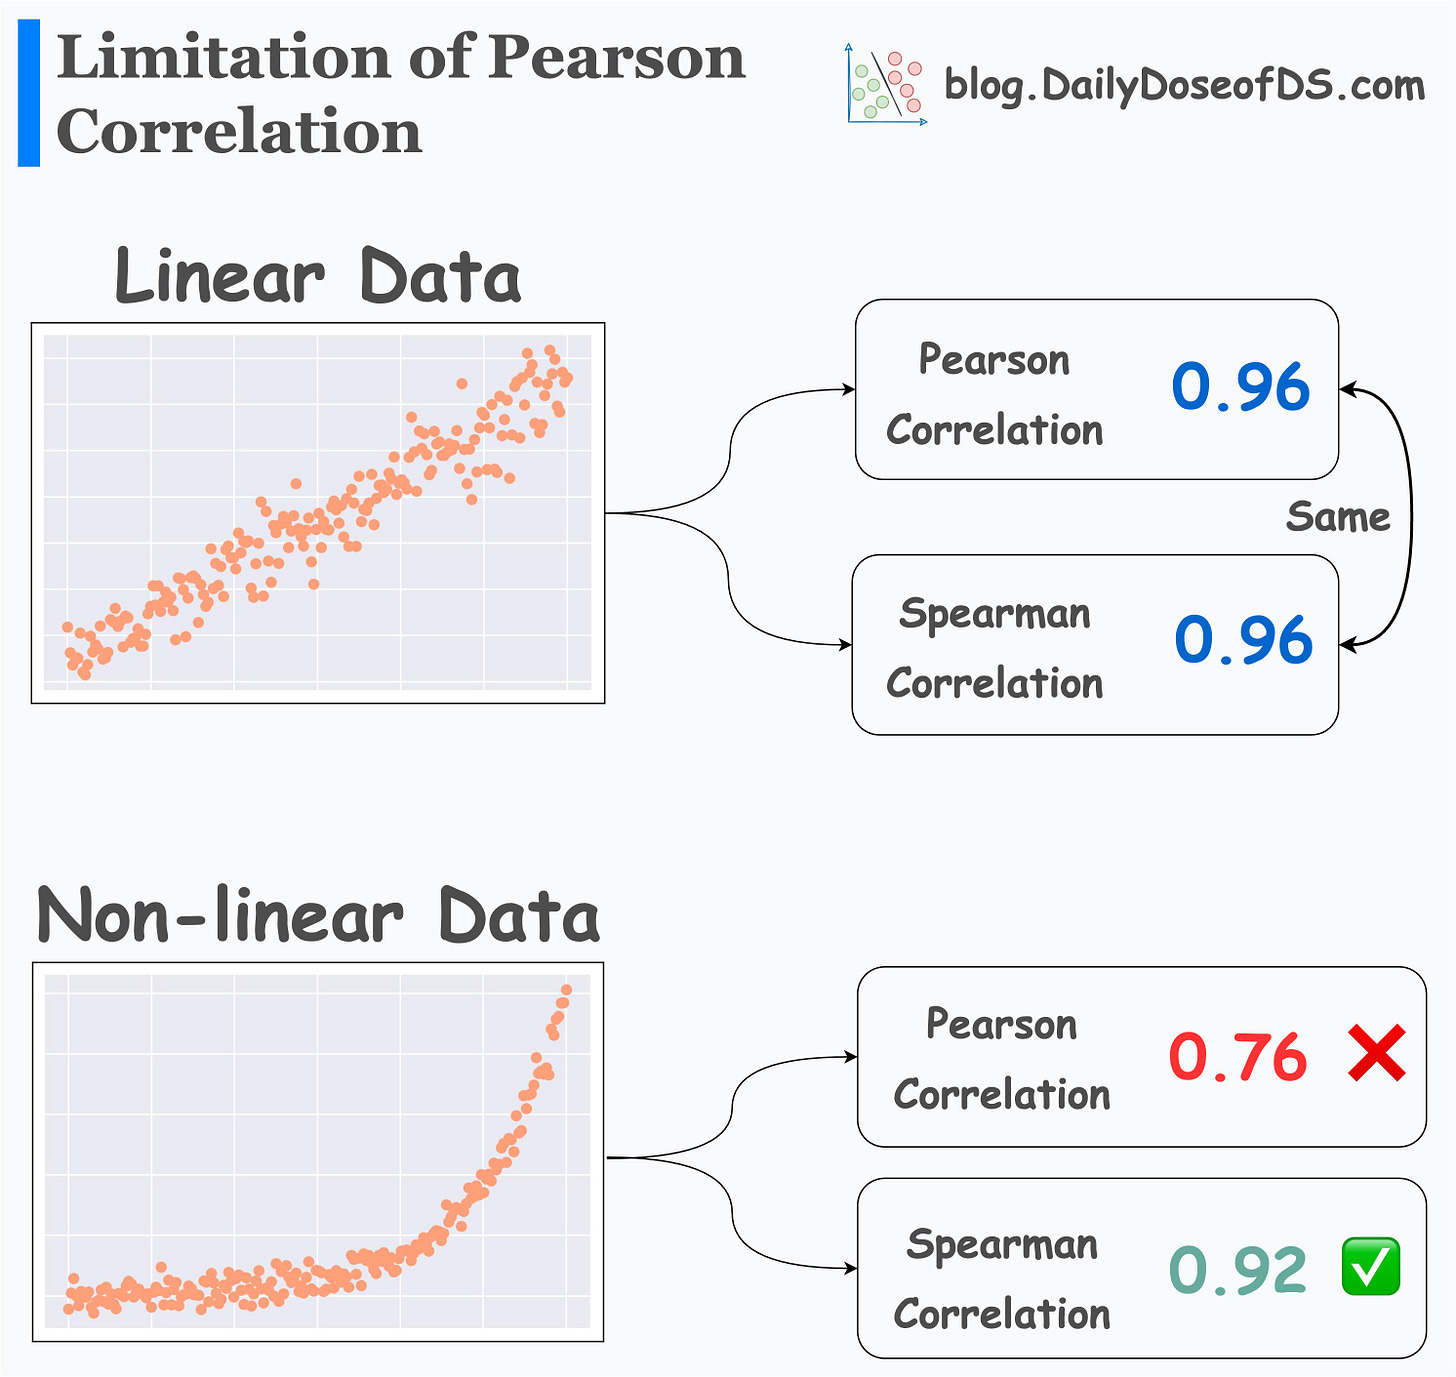
This is evident from the illustration below:
Pearson and Spearman correlation is the same on linear data.
But Pearson correlation underestimates a non-linear association.
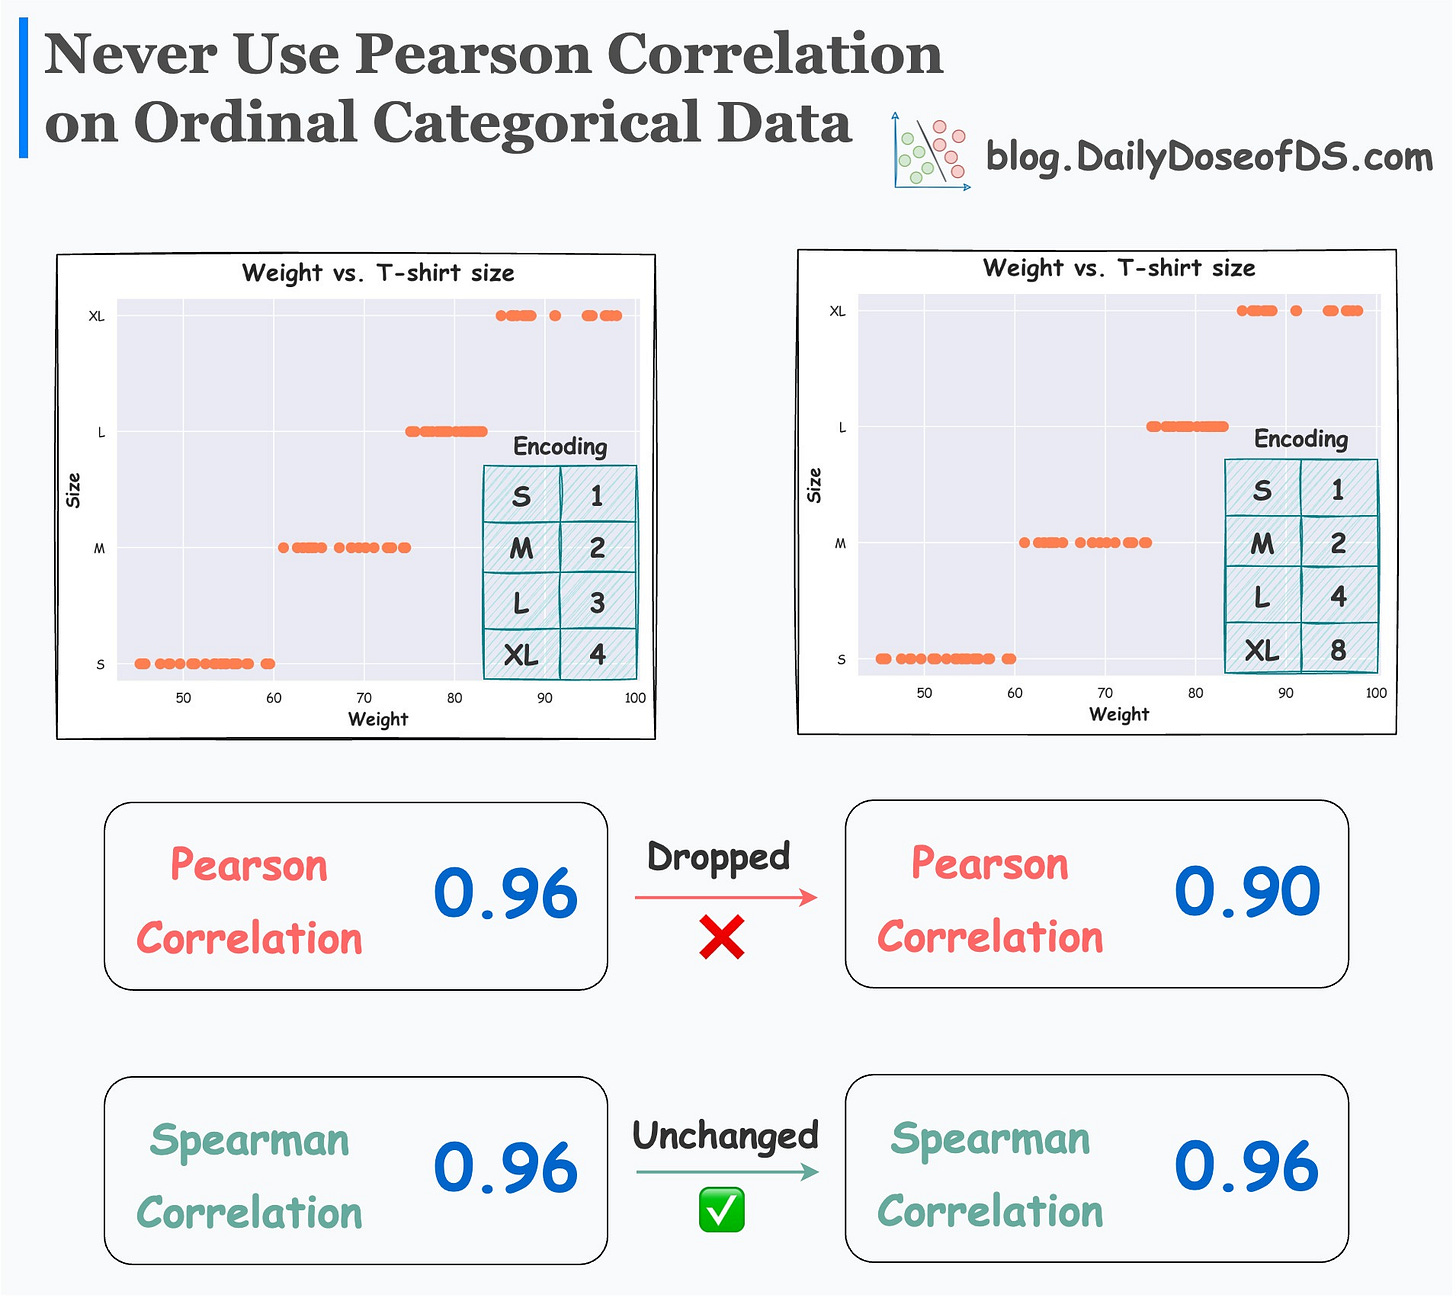
Spearman correlation is also useful when data is ranked or ordinal. If you want to learn more about this, we covered it in this issue: How to Assess Correlation with Ordinal Categorical Data?
Also, before I end, remember to always be cautious before drawing any conclusions using summary statistics.
While analyzing data, so many people get tempted to draw conclusions solely based on its statistics. Yet, the actual data might be conveying a totally different story.
This is also evident from the image below:
All nine datasets have approx. zero correlation between the two variables. However, the summary statistic, Pearson correlation in this case, gives no clue about what’s inside the data because it is always zero.
In fact, this is not just about Pearson correlation but applies to all summary statistics. The idea is that whenever you generate any summary statistic, you lose essential information.
Thus, the importance of looking at the data cannot be stressed enough. It saves us from drawing wrong conclusions, which we could have made otherwise by looking at the statistics alone.
👉 Over to you: What are some other alternatives that address Pearson’s limitations?
For those who want to build a career in DS/ML on core expertise, not trends:
Every week, I publish no-fluff deep dives on topics that truly matter to your skills for ML/DS roles.
For instance:
15 Ways to Optimize Neural Network Training (With Implementation)
Conformal Predictions: Build Confidence in Your ML Model’s Predictions
Quantization: Optimize ML Models to Run Them on Tiny Hardware
5 Must-Know Ways to Test ML Models in Production (Implementation Included)
Implementing Parallelized CUDA Programs From Scratch Using CUDA Programming
And many many more.
Join below to unlock all full articles:
SPONSOR US
Get your product in front of ~90,000 data scientists and other tech professionals.
Our newsletter puts your products and services directly in front of an audience that matters — thousands of leaders, senior data scientists, machine learning engineers, data analysts, etc., who have influence over significant tech decisions and big purchases.
To ensure your product reaches this influential audience, reserve your space here or reply to this email to ensure your product reaches this influential audience.


