Build Interactive Data Apps of Scikit-learn Models Using Taipy
A low-code data pipeline interface to compare various models.
Data scientists and machine learning engineers mainly use Jupyter to explore data and build models.
However, building an interactive app is better for those who don’t care about our code and are interested in results.
While we have previously discussed about Taipy, an open-source full-stack data application builder using Python alone (I also like to call it a supercharged version of Streamlit), we are yet to do a practical demo of building a data application.
So today, let me walk you through building a simple data pipeline:
It will train various classification models implemented in sklearn.
It will plot their decision region plots to let the user visually assess their performance.
By the end of this newsletter, we would have built the following app:
Let’s begin!
Building blocks of Taipy apps
A typical data pipeline has a series of steps, such as:
Load data → select columns → clean data → fit model → predict → find training score → find test score.
But if you look closely, is it necessary to go step-by-step?
In other words, an optimal execution graph can look something like this:
Unless explicitly implemented, traditional data application builders (and even Python scripts) can not take advantage of such parallelization. As a result, they resort to a step-by-step execution, which is not optimal.
However, data apps built with Taipy can leverage such optimizations.
There are four core components of Taipy that facilitate this:
Data node → A placeholder for data like text, numbers, class objects, CSV files, and more.
Task → A function to perform a specific task in the pipeline — cleaning data, for instance. Thus, it accepts data node(s) as its input and outputs another data node, which can be an input to another task.
Pipeline → A sequence of tasks to be executed (with parallelism and caching).
Scenario → A Scenario configuration defines a given pipeline. An instance/execution of such configuration is called a Scenario. Typically, a new Scenario is needed (created and executed) when we execute the pipeline with modified/different inputs.
Next, let’s understand how we can utilize them in Taipy to build efficient data apps.
Prerequisites
To get started, install Taipy:
Next, install Taipy Studio, a VS Code extension. It provides a graphical interface to build and visualize data pipelines.
These are the steps: VS Code →Extensions → Search Taipy Studio → Install.
Sklearn Model app using Taipy
You can download the code for this project here: Taipy-Sklearn demo.
It would be better if you download the above code, open it in VS code, and read this newsletter side-by-side.
We will be creating four Python files in this project:
main.py: This will be the project’s base file.config.py: This will define the connections between tasks, which data nodes they accept, and what data nodes they output.algos.py: This will implement the tasks utilized in our data pipeline. So here’s where we will train the models and create their decision region plots.interface.py: This will implement the interface for the user to interact with our data app. We discussed creating interfaces in Taipy in an earlier issue, so we won’t go through it again. Note that if you are not comfortable with Taipy's GUI Markdown syntax, Taipy also provides a pure Python interface.
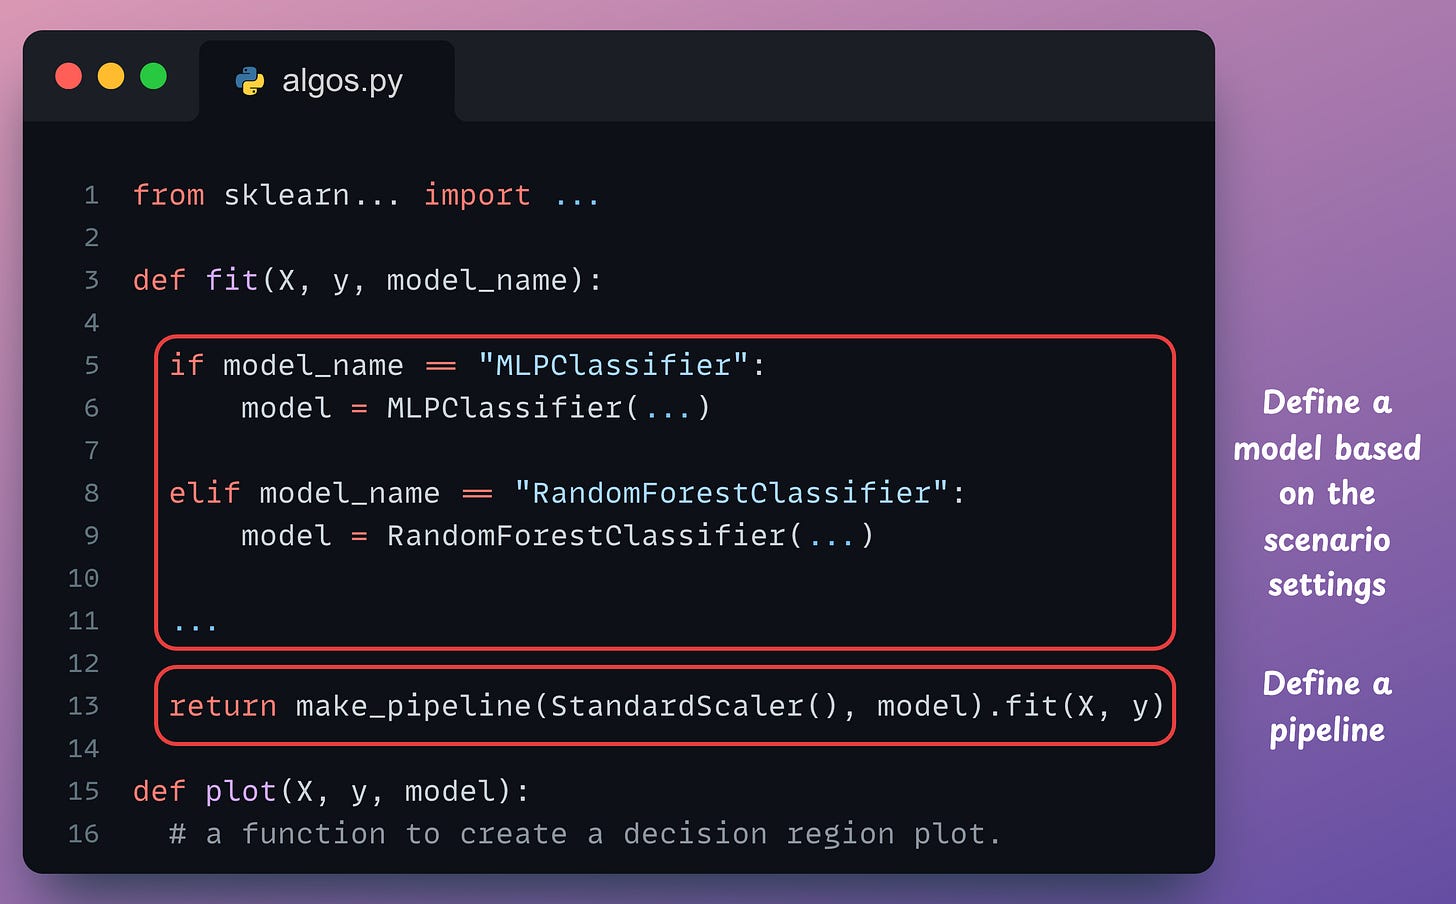
First, let’s look at the algos.py file as that one is the easiest to begin with.
It has two functions:
fit: Based on the parameter valuemodel_name, it creates a model object.plot: This method accepts themodeltrained above and returns a decision region plot.
Next, consider the config.py file. It imports the two functions defined in the algos.py file above and the Config class of Taipy library.
Let’s look at the configure() method in detail.
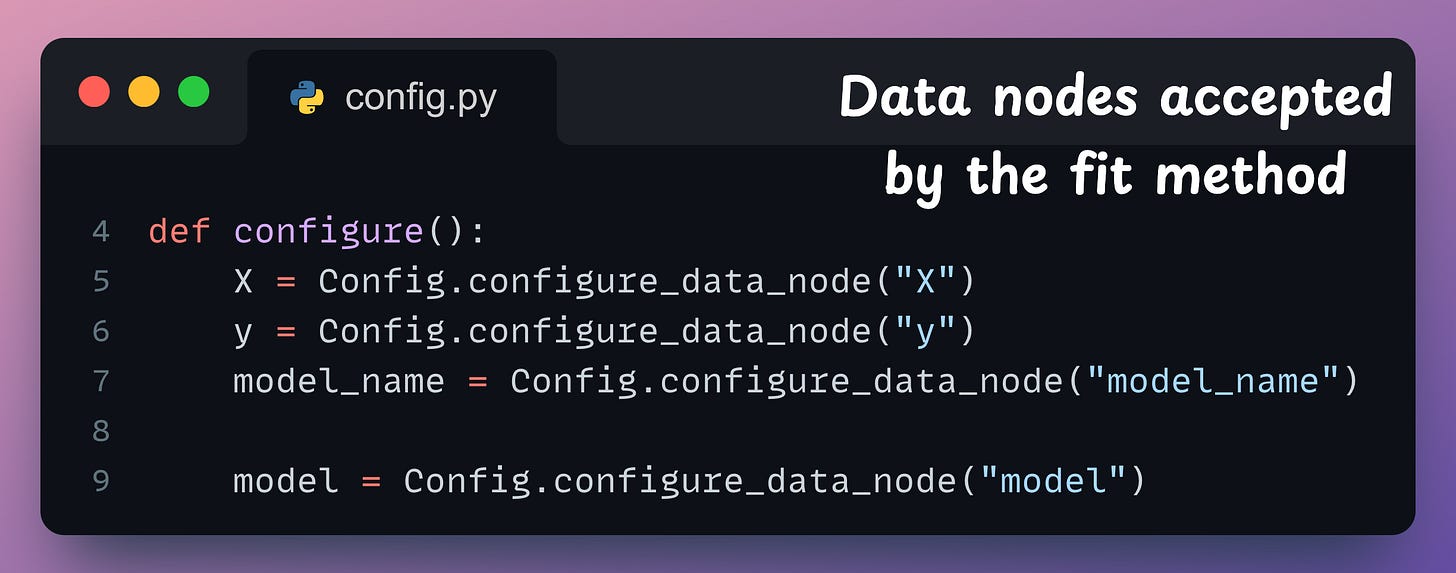
Recall that the fit() method defined above has three parameters → X, y, and model_name.
Thus, we define those as data nodes in the first three lines:
The output of fit() method is a model object, which is also a data node. Thus, we define that too in line 9.
Moving on, we define a task in the pipeline to fit a model.
1st argument: Name of the task → “fit”
2nd argument: Function this task is supposed to execute →
fit.3rd argument: The input data nodes accepted by the task (We defined them in earlier lines of the
configuremethod)4th argument: The data node outputted by the task.
Similarly, we define a task to plot the decision regions as well:
1st argument: Name of the task → “plot”
2nd argument: Function this task is supposed to execute →
plot.3rd argument: The input data nodes accepted by the task (We defined them in earlier lines of the
configuremethod)4th argument: The data node outputted by the task, a
figureobject.
This defines our pipeline.
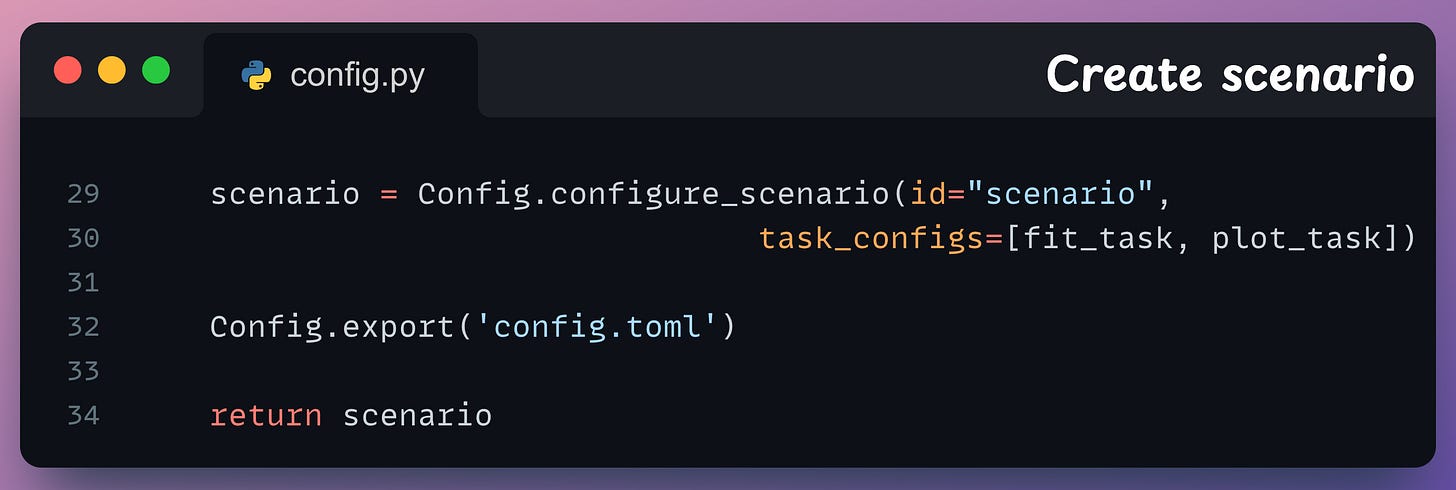
Finally, we bind the tasks together in a scenario, export the configuration to a TOML file (for visualization), and return the scenario:
We will see shortly that once we run the pipeline, it will create a config.toml file, which can be visualized using Taipy Studio (the extension we installed earlier):
The diagram makes it quite easy to visualize how different tasks and data nodes contribute to the overall pipeline.
Next, let’s look at the main.py file, which is the base file of this project.
We import the following here:
The taipy library.
The
configure()method we defined in theconfig.pyfile.The GUI markdown object (
interface) defined ininterface.py.The Core and GUI components of Taipy.
Coreis used to run pipelines.GUIis used to define a web interface.
The method to create
moonsdataset from sklearn.
Under the main block (if __name__ == "__main__"), we first instantiate an object of the Core class imported above, and a standard scenario configuration defined in the configure method:
Next, for every model:
We create a scenario (line 25).
Specify values for the data nodes (lines 27-29) that are needed to start the scenario, and submit it (line 31).
Finally, under the same main block, we create our GUI by passing the Markdown object created in interface.py.
Done!
Executing this as follows launches the data app I showed you above:
Wasn’t that simple?
To recap, here’s what we did:
We implemented all the tasks in algos.py.
In config.py, we defined the overflow workflow of our data application and how different tasks and data nodes interacted with one another.
In interface.py, we defined our graphical interface.
In main.py, we launched all independent scenarios by specifying data node values and executing the application.
The whole application was entirely Pythonic and did not take more than 160-180 lines of code to implement.
You can find the code for this project here: Taipy-Sklearn demo.
A departing note
Taipy is genuinely one of the best application builders I have ever used. It’s hard for me to switch to any alternatives now.
The latency difference is quite noticeable in practical apps when I use Taipy as compared to other apps, as depicted below:
Taipy has witnessed exponential growth over the last couple of months or so, which shows that more and more programmers are adopting it and finding it useful.
It has also trended on GitHub multiple times.
They are releasing new updates almost every week now, so do give them a star on GitHub to support their work: Taipy GitHub.
I love Taipy’s mission of supporting data scientists and machine learning engineers in building full-stack apps themselves while Taipy takes care of all backend optimizations.
They are solving a big problem with existing tools, and I’m eager to see how they continue!
Get started with:
🙌 A big thanks to the Taipy team, who very kindly partnered with me on this newsletter issue.
👉 Over to you: What problems will you use Taipy for?
Thanks for reading!
SPONSOR US
Get your product in front of more than 76,000 data scientists and other tech professionals.
Our newsletter puts your products and services directly in front of an audience that matters — thousands of leaders, senior data scientists, machine learning engineers, data analysts, etc., who have influence over significant tech decisions and big purchases.
Ad spots typically sell out about 3-4 weeks in advance. To ensure your product reaches this influential audience, reserve your space here or reply to this email.


