Visualise a Confusion Matrix Using Sankey Diagram
An unexplored direction of visualising a confusion matrix.
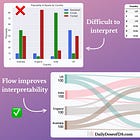
A confusion matrix is mostly viewed either as a raw NumPy array or a visualization, as depicted below:
I find both of them difficult to interpret.
The NumPy array does not tell whether rows depict the predicted label or the true label (the same thing is observed with columns).
The plot on the right depicts what’s missing from the NumPy array, but these raw prediction counts in each cell force me to do some mental calculations to determine precision and recall.
If you face similar issues, try plotting a confusion matrix as an interactive Sankey diagram.
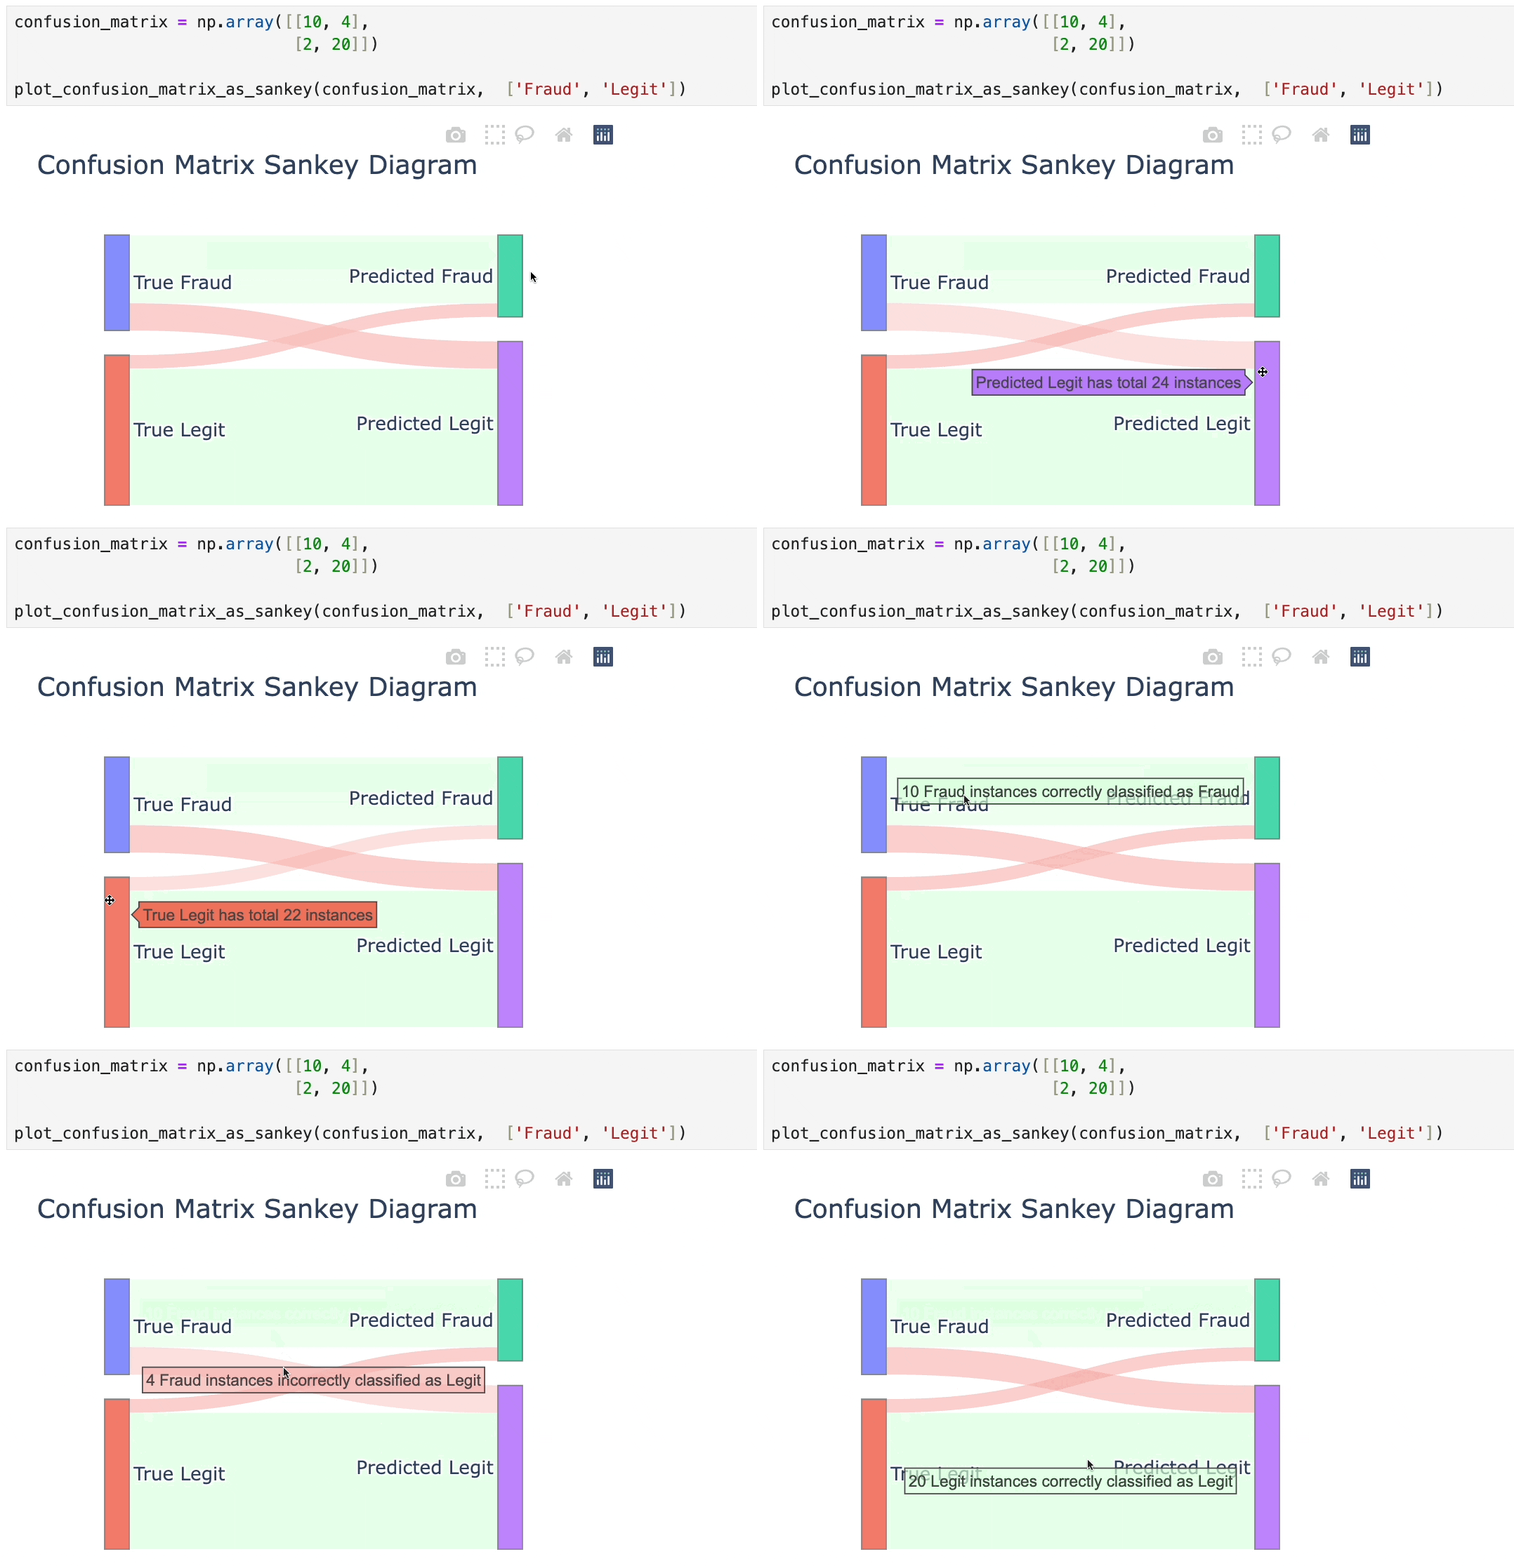
This is demonstrated below:
Here’s how it solves the problems discussed earlier:
Firstly, as shown above, one can interactively determine the number of instances belonging to each class and how they were classified.
Next, hovering over the connections gives more info about those instances, which can offer better interpretability, for instance:
“10 Fraud instances correctly classified as Fraud.”
“2 Legit instances incorrectly classified as Fraud.”
and more.
The Sankey diagram also helps me get a visual estimate for precision and recall:
Of course, everyone has visualization preferences, so do share your opinion about this.
Is this a better approach over the traditional ones?
That said, if you face issues with interpreting the confusion matrix, here’s a video I published in this newsletter once:
We also covered Sankey diagrams pretty recently in the newsletter, which you can find below:
You can find the code for creating the above confusion matrix using a Sankey diagram here: Jupyter Notebook.
Are you overwhelmed with the amount of information in ML/DS?
Every week, I publish no-fluff deep dives on topics that truly matter to your skills for ML/DS roles.
For instance:
Conformal Predictions: Build Confidence in Your ML Model’s Predictions
Quantization: Optimize ML Models to Run Them on Tiny Hardware
5 Must-Know Ways to Test ML Models in Production (Implementation Included)
Implementing Parallelized CUDA Programs From Scratch Using CUDA Programming
You Are Probably Building Inconsistent Classification Models Without Even Realizing
And many many more.
Join below to unlock all full articles:
SPONSOR US
Get your product in front of 87,000 data scientists and other tech professionals.
Our newsletter puts your products and services directly in front of an audience that matters — thousands of leaders, senior data scientists, machine learning engineers, data analysts, etc., who have influence over significant tech decisions and big purchases.
To ensure your product reaches this influential audience, reserve your space here or reply to this email to ensure your product reaches this influential audience.


